Содержание
Руководство по работе с Arinst SSA-TG R3
Анализатор спектра со встроенным трекинг-генератором Arinst SSA TG R3
1. Назначение
Arinst SSA-TG R3 – это портативный панорамный анализатор спектра со встроенным трекинг-генератором и демодулятором, предназначен для отображения спектральных составляющих сигналов в диапазоне частот от 24 МГц до 12 ГГц. Высокая скорость сканирования дает возможность обнаруживать импульсные сигналы цифровых стандартов связи: Wi-Fi, 2G, 3G, 4G, LTE, CDMA, DCS, GSM, GPRS, ГЛОНАСС и т.д. Встроенный следящий генератор позволяет проводить измерения АЧХ пассивных или активных устройств, например, фильтров, усилителей. Программный демодулятор ШЧМ/ЧМ/АМ сигналов предназначен для прослушивания эфира и настройки аналоговых радиопередатчиков. Для удобства работы встроенное МПО прибора позволяет подписывать и выделять цветом на экране частотные диапазоны. Например, подписать названия радиостанций, каналы WiFi или диапазоны частот мобильных операторов.
2. Технические характеристики
| Частотный диапазон | |
| Отображаемый диапазон частот1 | 24 МГц-12 ГГц |
| Измеряемый диапазон частот | 24 МГц -9 ГГц |
| Максимальная полоса обзора | ~12 ГГц |
| Опорный генератор TXCO GPS | 26 МГц |
| Разрешение по частоте | 25, 10, 5, 2.5 кГц |
| Полка шума2 | |
| в полосе 24 МГц — 6.2 ГГц | -110 дБм |
| в полосе 6.2 ГГц — 9 ГГц | -100…-70 дБм |
| в полосе 9 ГГц – 12 ГГц | -70 дБм |
| Параметры сканирования3 | |
| Максимальная скорость сканирования | 20 ГГц/с |
| Минимальное время обзора полной полосы частот 12 ГГц | 0.6 с |
| РЧ вход | |
| Усиление при включенном аттенюаторе | -15 дБ |
| Усиление при включенном малошумящем усилителе | +15 дБ |
| Волновое сопротивление | 50 Ом |
| КСВ в рабочем диапазоне частот | < 2.0 |
| Максимальная входная мощность при выключенном аттенюаторе и МШУ | 0 дБм |
| Максимальная входная мощность при включенном аттенюаторе | +15 дБм |
| Максимальная входная мощность при включенном МШУ | -15 дБм |
| Максимальное постоянное напряжение на входе | 25 В |
| Трекинг-генератор | |
| Режимы измерений4 | фикс., S21 |
| Нормированный уровень выходной мощности в полосе 24-6200 МГц | -8 дБм : — 29 дБм |
| Нормированный уровень выходной мощности в полосе 6200-12000 МГц | -14 дБм |
| Глубина регулировки мощности в полосе 24-6200 МГц | 21 дБ |
| Шаг регулировки мощности в полосе 24-6200 МГц | 3 дБ |
| Демодулятор | |
| Типы демодуляции | ШЧМ, ЧМ, АМ |
| Функции | АРУ, S-метр, пороговый шумоподавитель |
| Полосы для ШЧМ | 400, 300, 200, 100 кГц |
| Полосы для ЧМ, АМ | 20, 10, 8, 6, 4 кГц |
| Аудио выход | Динамик 2 Вт, наушники |
| Отображение | |
| Тип экрана | сенсорный резистивный, IPS |
| Разрешение экрана | 800×480 |
| Графики | спектр, водопад, S21 |
| Питание | |
| Ёмкость встроенного аккумулятора | 5000 мАч |
| Время непрерывной работы от аккумулятора | ~ 4 ч |
| Время заряда аккумулятора5 | ~ 3.5 ч |
| Интерфейс подключения к ПК | USB |
| Внешний блок питания | 7-24 В, 2 А. |
| Рабочий диапазон температур | 0 … +40°С |
| Габаритные размеры (Д×Ш×В) | 145x81x27 мм |
| Масса | 0,4 кг |
-
В диапазоне отображения не гарантируются точностные параметры сигналов.
-
Уровень шумовой полки измеряется при включенном МШУ и спектральном разрешении 2.5 кГц.
-
Измерения проводятся при режиме работы «Скорость» и спектральном разрешении 25 кГц.
-
Режим измерений скалярный – без учета фазы.
-
Источник должен обеспечивать мощность не менее 7 Вт.
3. Комплектность
-
Анализатор спектра ARINST SSA-TG R3.
-
Аккумулятор (установлен в приборе).
-
ВЧ переходник для защиты разъемов от износа (2 шт.).
-
Кабель mini-USB – USB 2.0.
-
Паспорт.
-
Упаковка.
4. Устройство прибора
—-
-
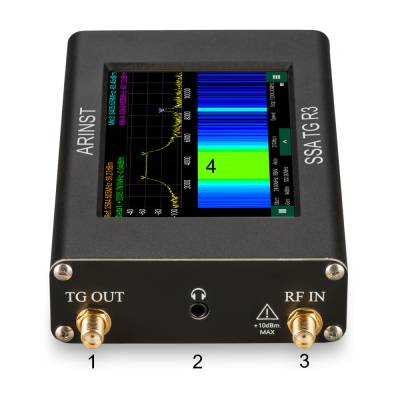
1 — Выход трекинг-генератора.
-
2 — Выход для наушников.
-
3 — Вход анализатора спектра.
-
4 — Сенсорный экран.
—-
-
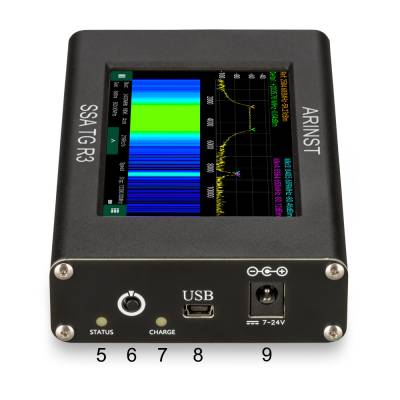
5 — Светодиод статуса.
-
6 — Кнопка включения.
-
7 — Светодиод заряда.
-
8 — Разъем для подключения к ПК и зарядки.
-
9 — Разъем для подключения внешнего блока питания.
—-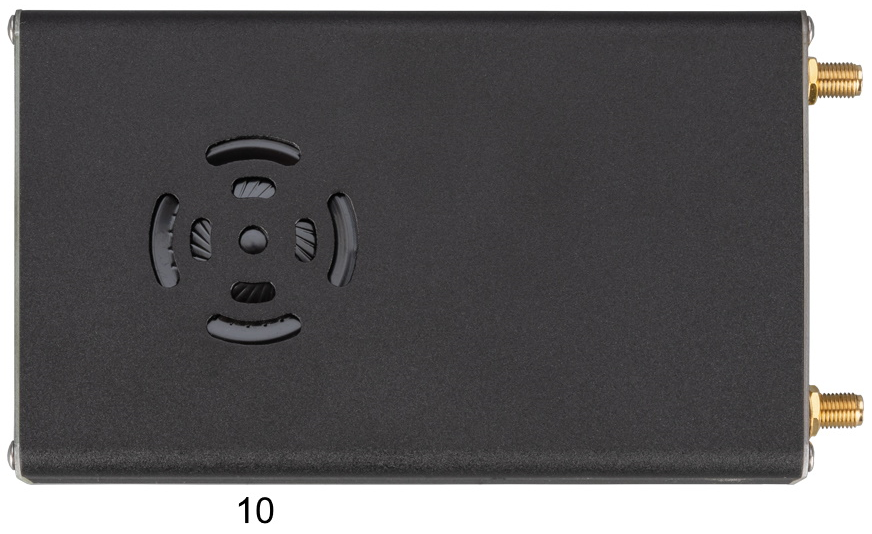
-
10 — Динамик.
5. Работа с прибором
Внимание!
![]() Не осуществляйте коммутацию входного ВЧ разъема при подключенном
Не осуществляйте коммутацию входного ВЧ разъема при подключенном
зарядном устройстве или USB соединении с ПК. При несоблюдении данных
рекомендаций возможен выход прибора из строя.
![]() Использование прибора под открытым небом во время снегопада или дождя
Использование прибора под открытым небом во время снегопада или дождя
запрещается. Если анализатор внесён в холодное время года из холодного помещения или с
улицы в тёплое помещение, не включайте его в течение времени достаточного для
испарения конденсата.
![]() Соотносите мощность сигнала и напряжение, подаваемые на Входной разъем RF IN с
Соотносите мощность сигнала и напряжение, подаваемые на Входной разъем RF IN с
максимальными значениями, указанными в технических характеристиках.
5.1. Включение
-
1. Убедитесь в том, что анализатор не имеет внешних повреждений и аккумулятор заряжен. Разряженный аккумулятор зарядите с помощью подключения к порту USB или к внешнему блоку питания.
-
2. Нажмите на кнопку включения и удерживайте нажатой несколько секунд.
-
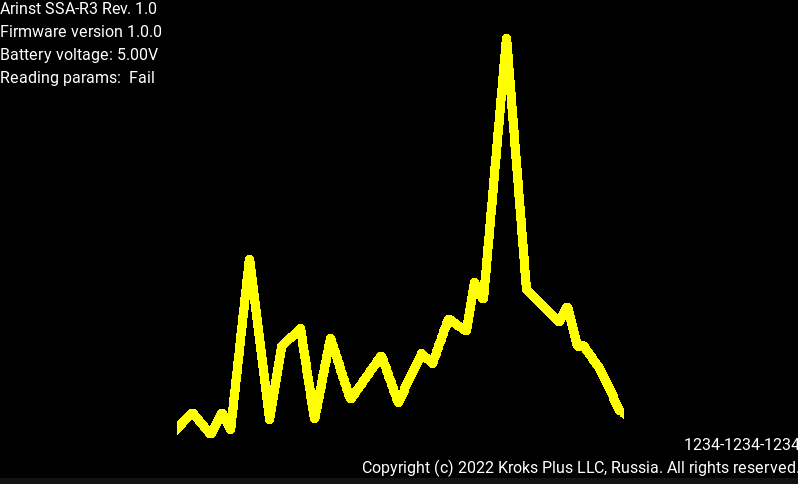
3. На экране должен появиться загрузочный режим с таблицей диагностических параметров.
-
4. После завершения диагностики на дисплее отобразится главный экран прибора.
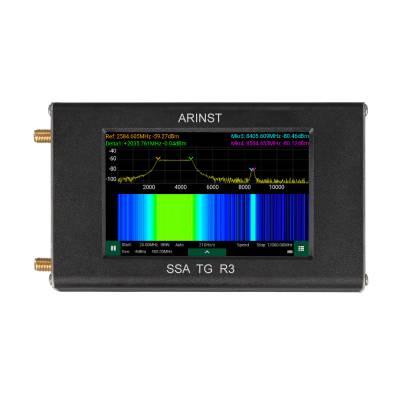
5.2. Главный экран прибора
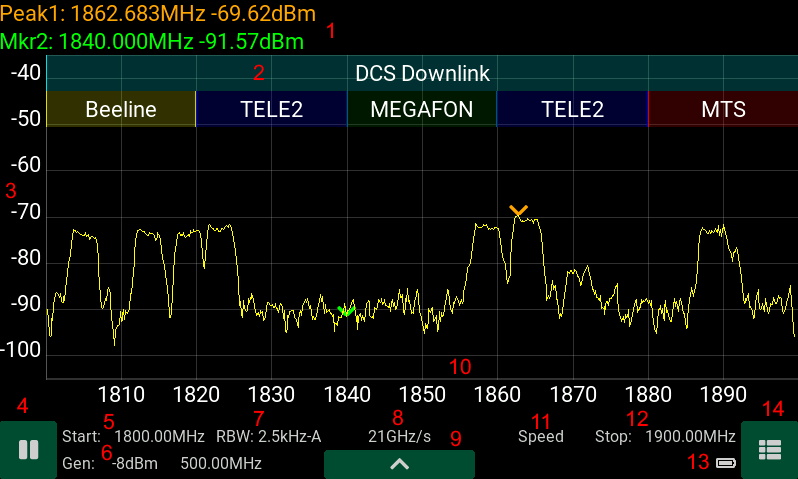
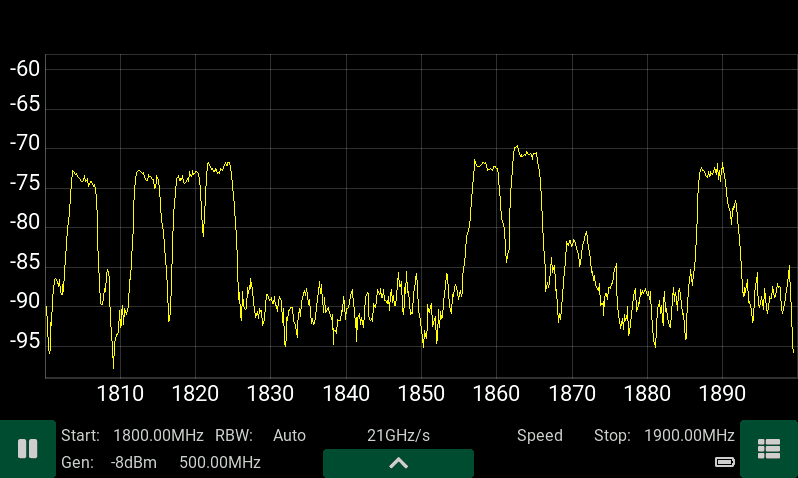
5.2.1. Описание элементов отображения
-
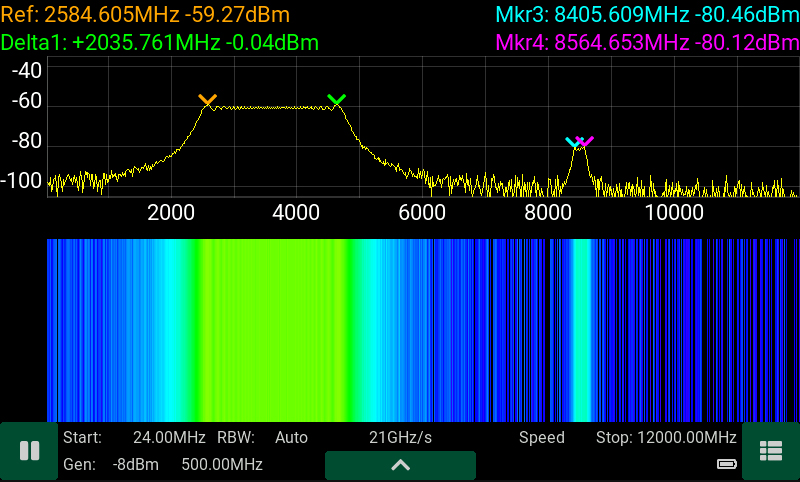
1. Поле маркеров — до 4 штук.
-
2. Поле частотных диапазонов.
-
3. Ось амплитуд в дБм.
-
4. Кнопка паузы.
-
5. Начальная частота сканирования в МГц.
-
6. Параметры встроенного генератора.
-
7. Разрешение по частоте.
-
8. Скорость сканирования.
-
9. Кнопка вызова дополнительного меню.
-
10. Ось частот в МГц.
-
11. Тип режима работы.
-
12. Конечная частота сканирования.
-
13. Индикатор заряда встроенного аккумулятора.
-
14. Кнопка вызова главного меню.
5.2.2 Дополнительное меню
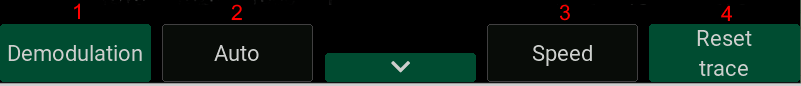
Для перехода в дополнительное меню нажмите на кнопку 8 на главном экране.
-
1. Переход в режим демодуляции.
-
2. Выбор разрешения по частоте.
-
3. Выбор режима сканирования.
-
4. Кнопка сброса накопленных значений для трассы (максимум, минимум, среднее)
5.2.3. Настройка графиков
Смещение сетки графика по частоте и амплитуде можно менять перетаскиванием шкалы, для изменения масштаба необходимо зажать шкалу около ее центра до момента как она станет красного цвета и, не отпуская, перетягивать.
5.3. Экран демодулятора
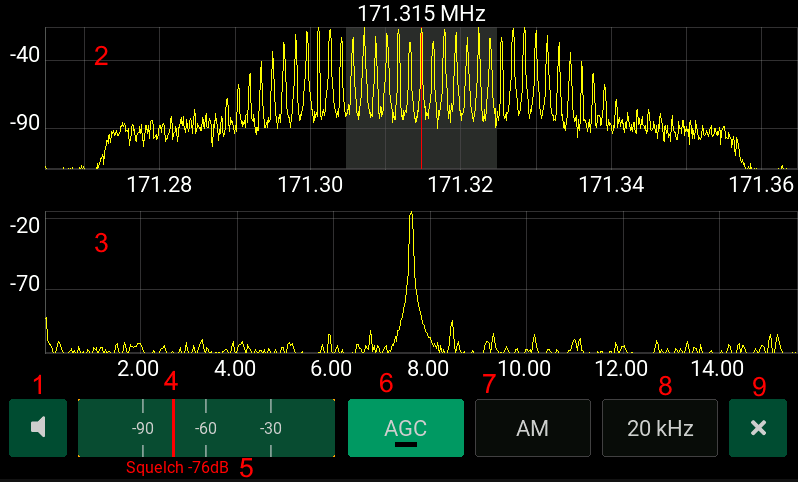
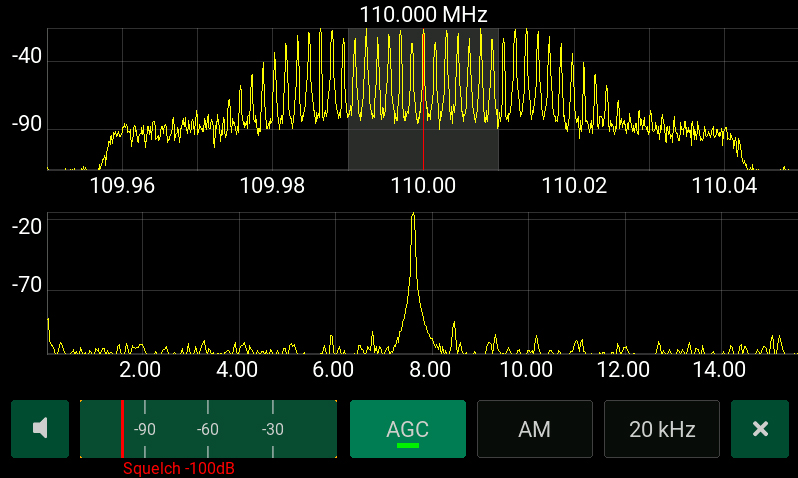
Для перехода в режим демодуляции нажмите на кнопку дополнительного меню. Центральная частота для демодуляции выбирается по установленному 1 маркеру либо по максимуму сигнала в спектре при отсутствии маркера.
Параметры демодулятора:
-
1. Меню регулировки громкости.
-
2. Спектр сигнала в полосе демодуляции.
-
3. Спектр демодулированного сигнала.
-
4. Индикатор S-метра.
-
5. Уровень порогового шумоподавителя (Squelch).
-
6. Кнопка включения/выключения АРУ.
-
7. Выбор типа демодулятора.
-
8. Выбор полосы демодулятора.
-
9. Кнопка выхода из режима демодуляции.
-
10. Центральная частота демодуляции.
Примечания:
Пороговый шумоподавитель — отключает аудиовыход при уровне S-метра ниже уровня шумоподавителя, изображенного красной риской на S-метре. Автоматическая регулировка усиления доступна только в режимах FM/AM.
5.3.1. Автоматическая регулировка усиления
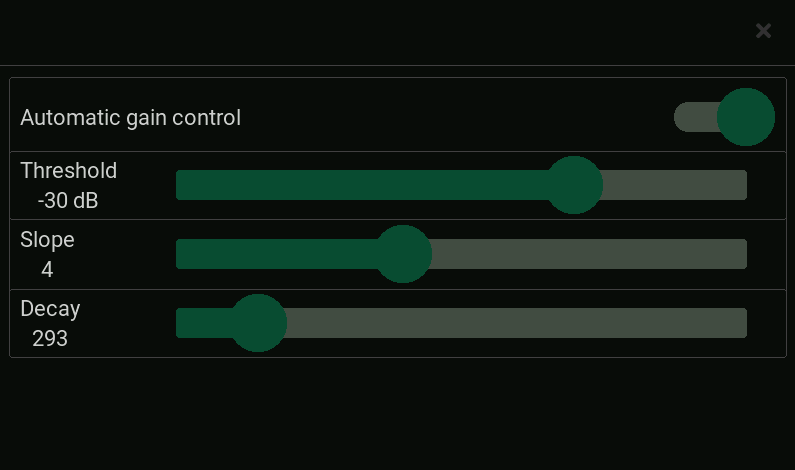
Параметры :
-
Threshold — пороговый уровень АРУ в дБ.
-
Slope — наклон АРУ в дБ в режиме насыщения.
-
Decay — время установления АРУ в мс.
Основная регулировка заключается в подборе порогового уровня для наиболее качественного звука. Параметр Decay подбирается в зависимости от типа жанра аудио — для музыки желательно ставить минимальные значения, для прерывистой речи максимальные. Параметр Slope подбирается по минимальным искажениям сигнала.
5.3.2. Настройка параметров демодулятора
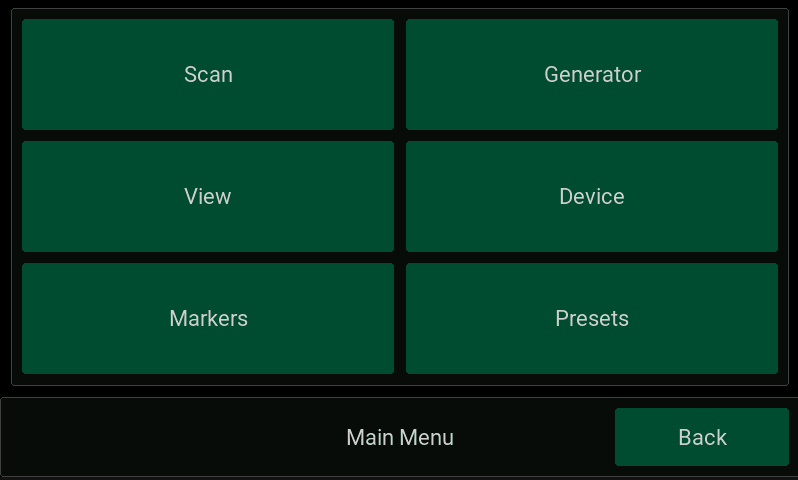
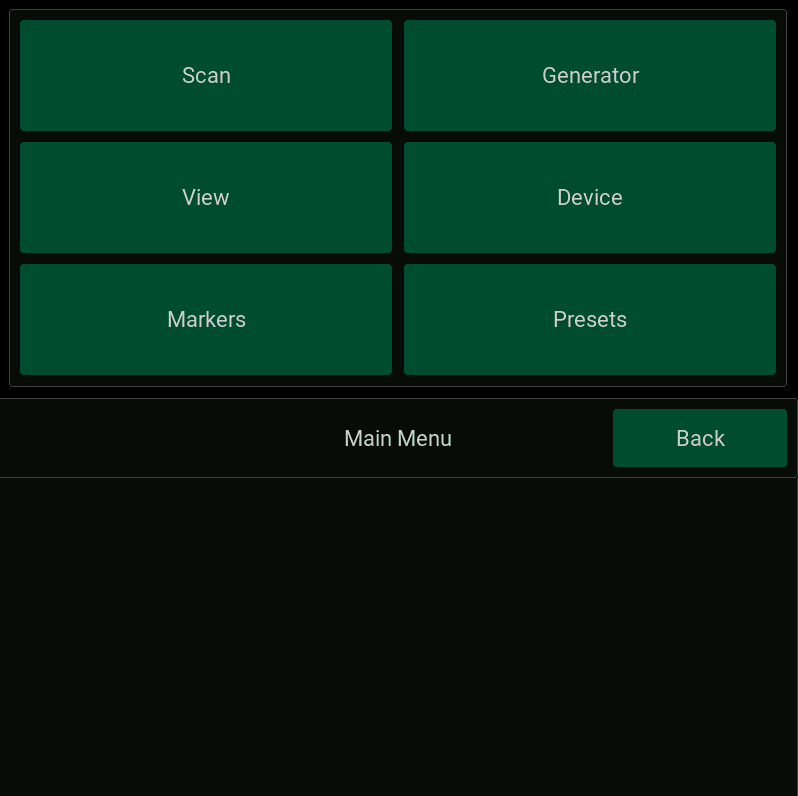
5.4. Интерфейс прибора
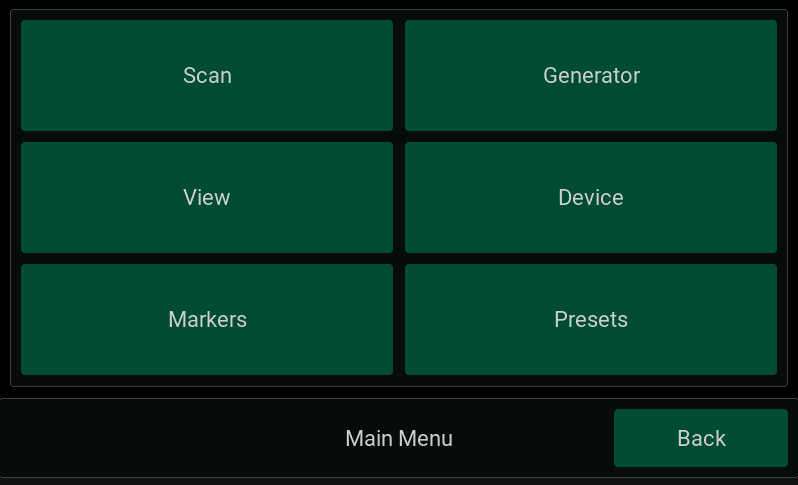
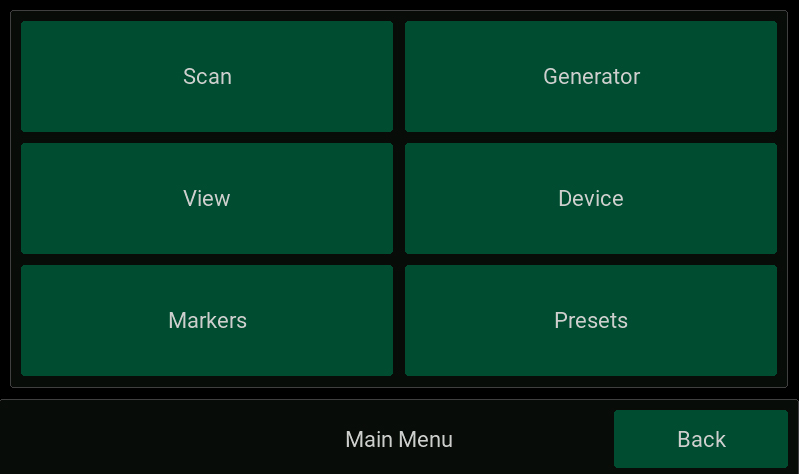
Основные вкладки:
-
1. Scan — параметры сканирования
-
2. View — параметры отображения
-
3. Markers — параметры отображения маркеров
-
4. Generator — параметры трекинг генератора
-
5. Device — серийный номер устройства, ориентация экрана и др.
-
6. Presets — менеджер предустановок.
Переход в основное меню осуществляется через однократное нажатие на кнопку питания либо нажатием на кнопку вызова меню 14 на экране.
5.4.1. Scan
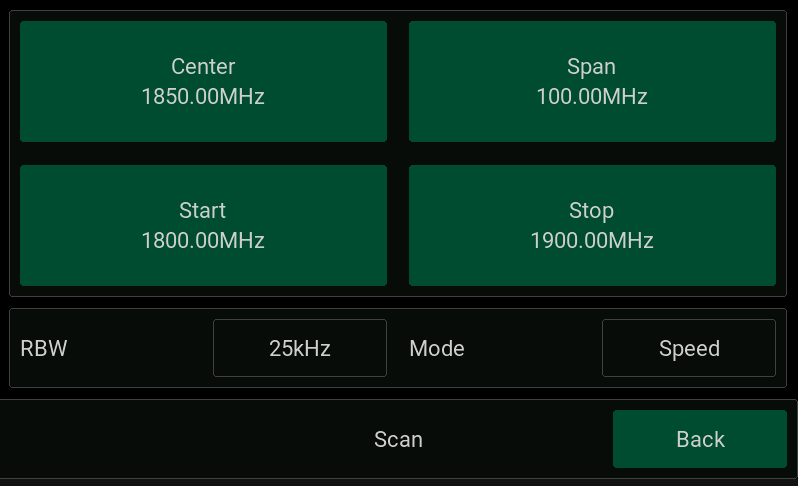
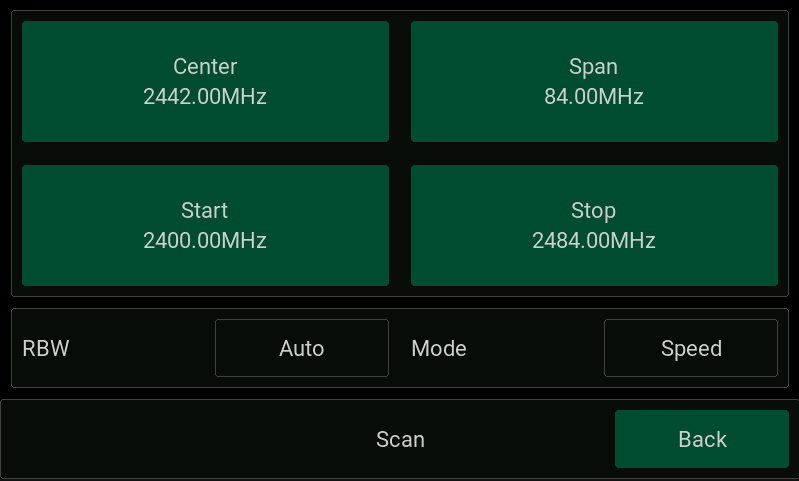
Параметры сканирования:
-
1. Center — центральная частота диапазона сканирования
-
2. Span — диапазон сканирования
-
3. Start — начальная частота сканирования
-
4. Stop — конечная частота сканирования
-
5. RBW — разрешение по частоте при сканировании
-
6. Mode — режим сканирования
RBW — (resolution bandwidth) разрешение по частоте. Определяет минимальную частоту между двумя сигналами, чтобы их можно было различить. Так же определяет точность вычисления частоты сигнала по маркеру.
Задается из списка:
-
1. Auto
-
2. 2.5 кГц
-
3. 5.0 кГц
-
4. 10 кГц
-
5. 25 кГц
В режиме Auto в зависимости от диапазона сканирования разрешение выставляется автоматически. На экране прибора выбранное значение отображается с суффиксом -A (2.5 kHz-A).
Так же в зависимости от частотного разрешения будет изменяться полка шума и скорость сканирования. Полка шума является минимальной для минимального частотного разрешения в 2.5 кГц и максимальной для 25 кГц (отличается на 10 дБ). Скорость сканирования, наоборот, будем максимальной для разрешения 25 кГц и минимальной для 2.5 кГц. Реальная скорость сканирования отображается на главном экране прибора.
Режим Mode — определяет режим сканирования — Speed(быстрый) или Presicion(точный). В анализаторе применяется программный алгоритм подавления зеркального канала, который может работать в двух режимах — в режиме Speed — алгоритм обладает максимальной скоростью сканирования, но при определенных соотношениях параметров входных сигналов возможно появление в спектре фантомных составляющих. А в режиме Precision алгоритм работает в 2 раза медленнее, но вероятность появления фантомных сигналов значительно ниже.
Для точных работ с медленноменяющимися сигналами следует выбирать минимальное разрешение по частоте 2.5 кГц и режим Presicion, для поиска импульсных сигналов следует выбирать максимальное разрешение 25 кГц и режим Speed.
5.4.2. Меню установки частоты
Примечание:
При вводе частоты с клавиатуры предыдущее значение будет удалено, так же для полного удаления ранее введенного значения зажмите клавишу удаления на 1 секунду. При смещении курсора ввода старое значение не будет удалено и можно изменить лишь необходимые разряды.
При выходе за рамки ограничений частотного диапазона будет выдано сообщение об ошибке.
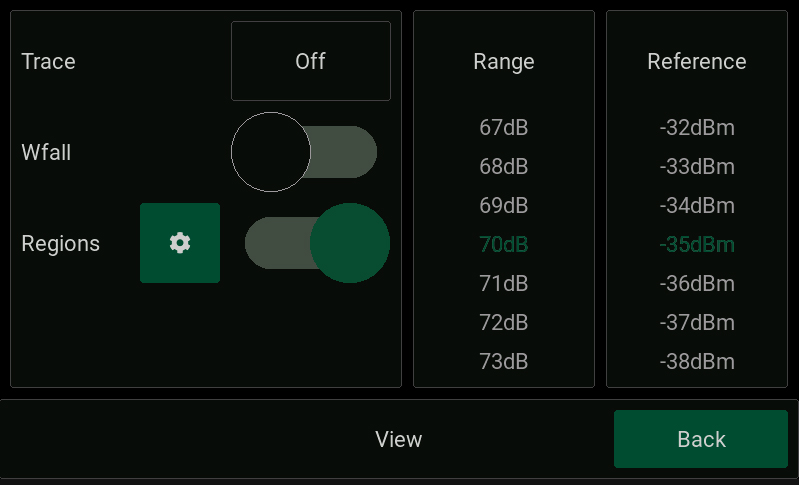
5.4.3. View
Установка режимов отображения.
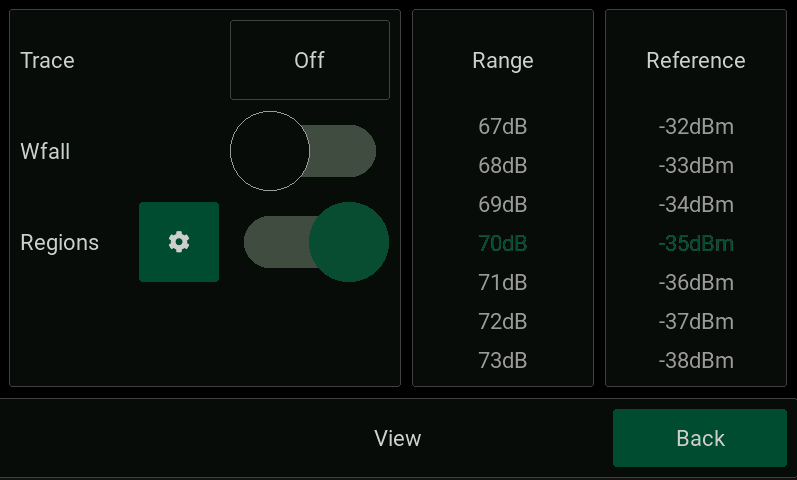
Trace — выбор режима отображения трассы:
-
1. Выключено
-
2. Трасса минимальных значений.
-
3. Трасса максимальных значений.
-
4. Трасса средних значений с окном 5 отсчетов.
-
5. Трасса средних значений с окном 10 отсчетов.
-
6. Трасса средних значений с окном 20 отсчетов.
-
Wfall — включение/выключение режима водопад (частотно-временная диаграмма)
-
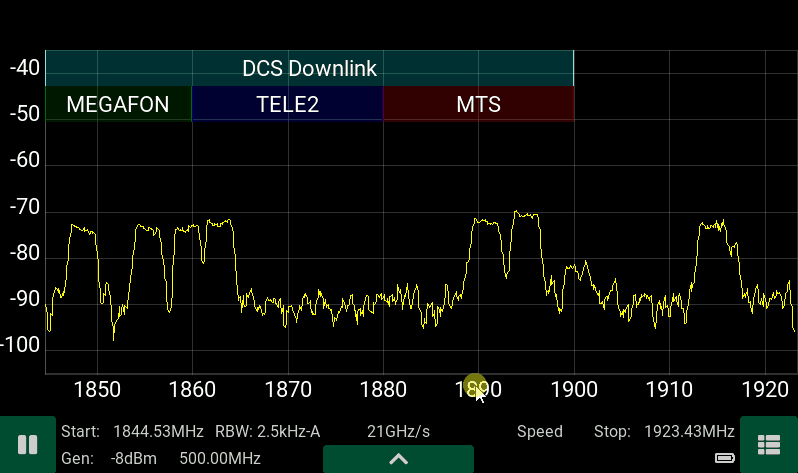
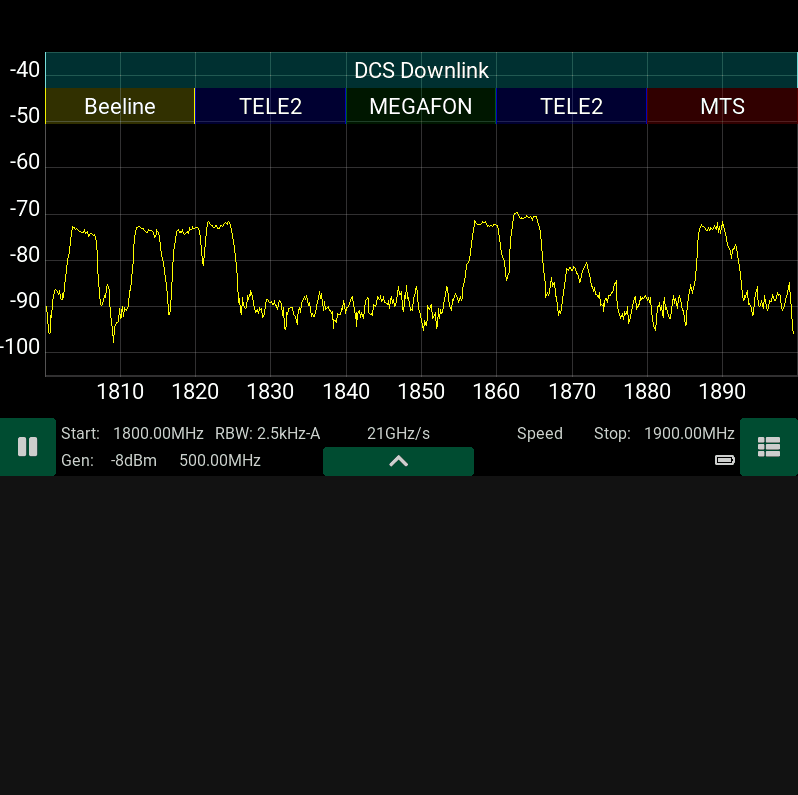
Regions — меню для задания названия частотного диапазона отображаемого на главном экране.
-
Range — диапазон отображения амплитуды на графике спектра в дБ.
-
Reference — верхний уровень шкалы амплитуды на графике в дБм.
5.4.3.1. Regions
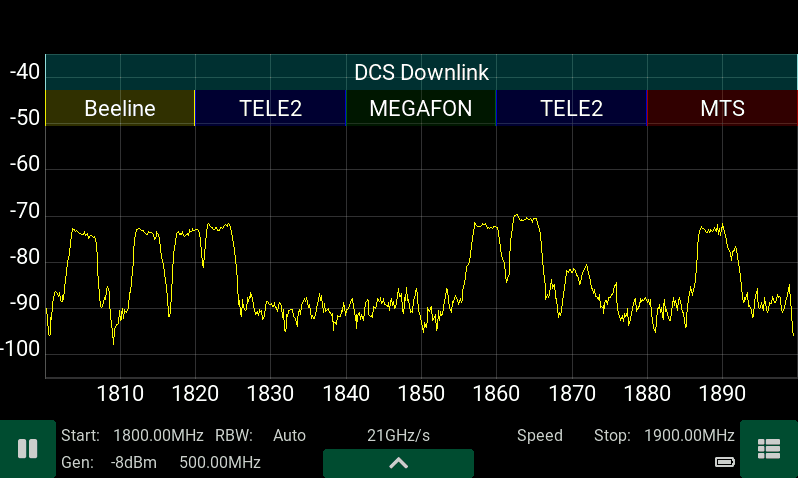
Для удобства работы встроенное ПО прибора позволяет подписывать и выделять цветом на экране частотные диапазоны.
Можно задать название частотного диапазона и его полосу частот, а так же цвет из палитры.
Максимальное количество частотных диапазонов — 32.
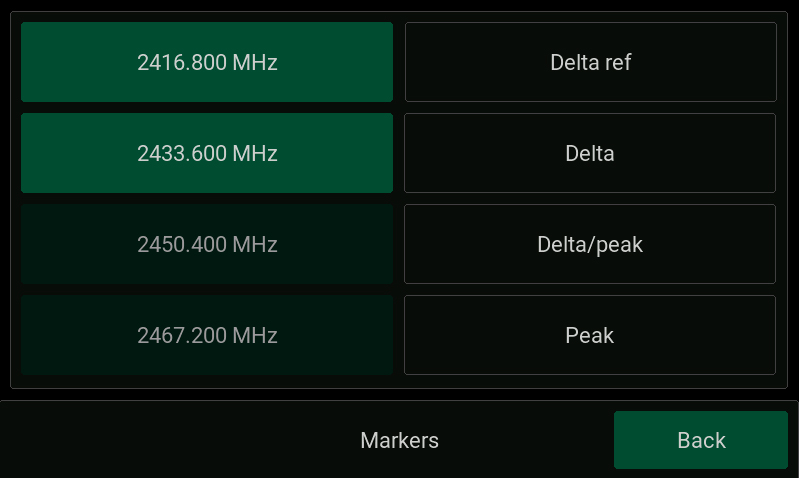
5.4.4. Markers
Маркеры позволяют точно определить значение амплитуды и частоты сигнала.
Установка маркеров — удержание стилуса вблизи интересующей области спектра. Удаление маркера — по нажатию и удержанию маркера. Для перемещения маркера по графику — необходимо его перетащить в нужную область.
Маркеры могут работать в нескольких режимах:
Независимый режим:
-
Point — маркер зафиксирован на определенной частоте и выдает значение амплитуды.
-
Peak — маркер ищет пиковый сигнал и выдает его значение.
Зависимый режим:
1 маркер:
-
Ref
-
Ref/peak
2,3,4 маркеры:
-
Delta
-
Delta/peak
В режиме Ref — опорный маркер отображает значение амплитуды и частоты в выбранной точке.
В режиме Ref/peak- опорный маркер отображает значение амплитуды и частоты в точке с максимальной амплитудой.
В режиме Delta — ведомые маркеры отображают значение амплитуды и частоты относительно опорного маркера.
В режиме Delta/peak- ведомые маркеры отображают значение амплитуды и частоты относительно опорного маркера в других точках с максимальным уровнем сигнала.
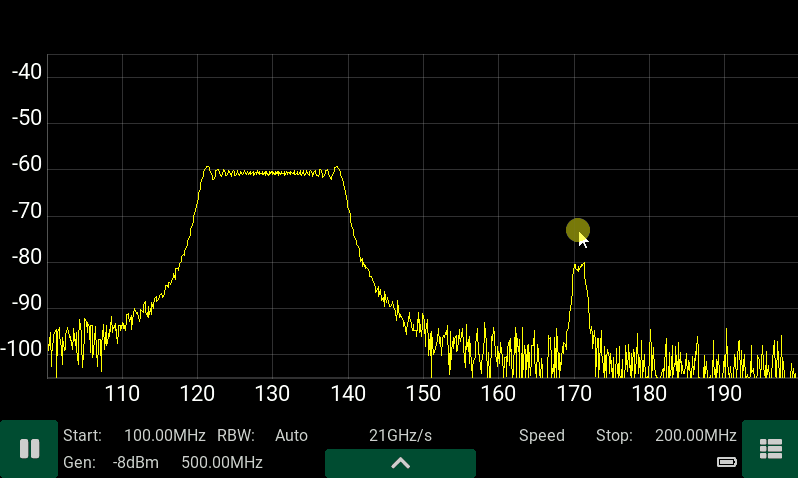
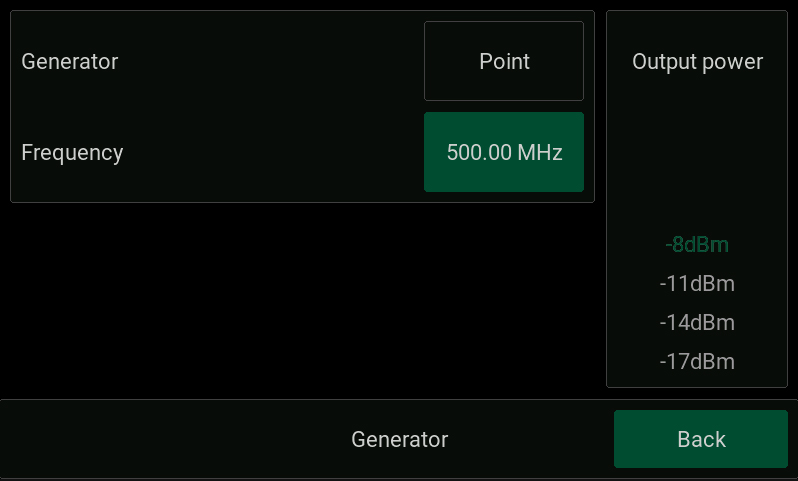
5.4.5. Generator
5.4.5.1. Режим Point
Выходная мощность генератора зависит от частотного диапазона работы — для диапазона 24-6200 МГц мощность может быть установлена в пределах -8…-29 дБм, для диапазона 6200-12000 МГц мощность фиксирована значением -14 дБм.
5.4.5.2. Режим Tracking S21

Для измерения амплитудно-частотной характеристики исследуемого устройства, установите частотный диапазон в меню Scan, установите выходную мощность генератора. Соедините перемычкой кабели и нажмите на кнопку Througth для калибровки прибора. Вместо перемычки подключите исследуемое устройство.
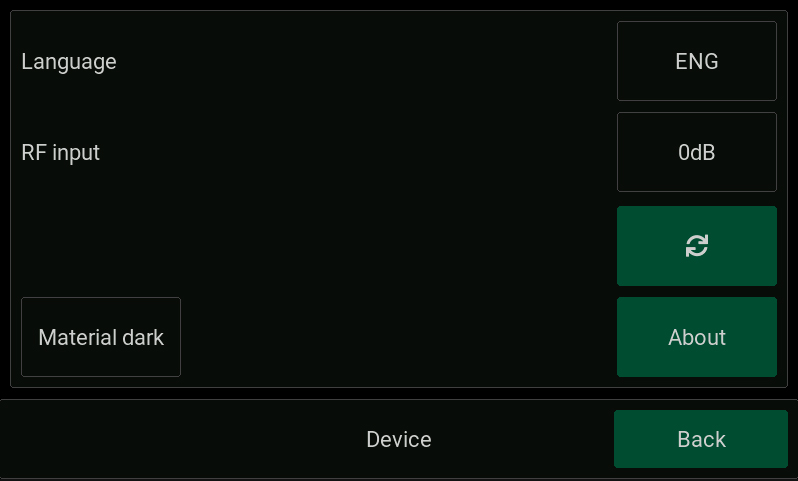
5.4.6. Device
-
Language — выбор языка Eng Рус.
-
RF input (выбор входа) — аттенюатор (-15 dB), прямой вход (0 dB), малошумящий усилитель (+15 dB).
-
Theme — тема отображения экранов.
-
Rotate screen — кнопка поворота ориентации экрана — вертикальная / горизонтальная.
-
About — информация об устройстве — версия прошивки, серийный номер.
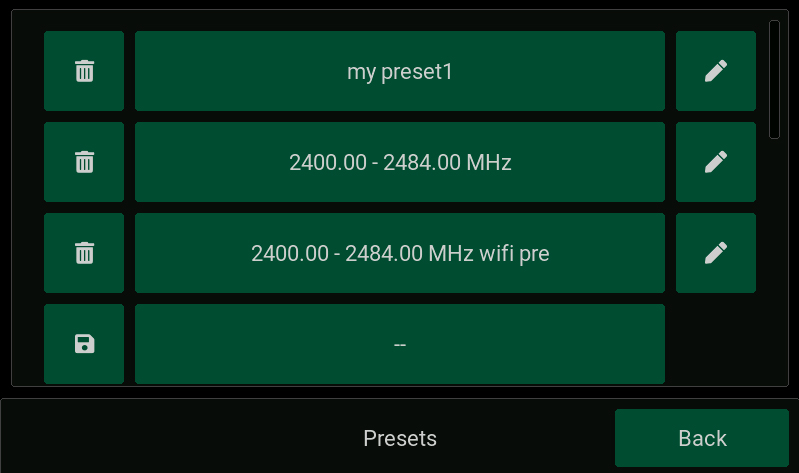
5.4.7. Presets

Меню для сохранения и загрузки пресетов — до 12 пресетов. В параметры пресета сохраняются все настройки прибора.
6. Дополнительные возможности
6.1. Выход на основной экран
Для быстрого выхода из любого меню следует однократно нажать на кнопку питания.
6.2. Измерение сигналов с высоким разрешением
Если требуются измерения сигнала с разрешением по частоте меньше чем 2.5 кГц, установите маркер на исследуемый сигнала и перейдите в режим демодуляции. Спектр после цифрового переноса, который будет отображаться вверху экрана для режима WFM будет иметь разрешение 122Гц, а режима FM — 8 Гц.
6.3. Вертикальная ориентация экрана
A complete instruction manual for the device is available on the website www.kroks.ru
Warranty
The manufacturer warrants that this product will meet the specifications in this document. The warranty period is 12 months
from the date of purchase. During this period, the manufacturer provides free warranty service.
Warranty obligations do not apply to the following cases:
the warranty period of the product has expired from the date of sale;
there are no documents confirming the date and fact of purchase of the product;
the product intended for personal needs was used for commercial activities, as well as for other purposes that do not
correspond to its intended purpose;
Violation of the rules and operating conditions set forth in the Operating Instructions and other documentation
transferred to the Buyer complete with the product;
if there are traces of unskilled repairs or attempts to open the Product outside an authorized service center, as well as
due to unauthorized interference with the software;
damages (shortcomings) of the Goods are caused by exposure to virus programs, software interference, or the use of
third-party software (non-original);
the defect is caused by force majeure (for example, earthquake, fire, lightning strike, instability in the electrical
network), accidents, intentional or careless actions of the consumer or third parties;
mechanical damage (cracks, chips, holes) that occurred after the transfer of the product to the Buyer;
damage caused by exposure to moisture, high or low temperatures, corrosion, oxidation, ingress of foreign objects,
substances, liquids, insects into the product;
the defect arose due to the supply to the input connectors, terminals, signal housing or voltage or current exceeding
the values allowed for this Product;
the defect is caused by natural wear of the Goods (for example, but not limited to: natural wear of connectors due to
frequent connection/disconnection of adapters).
Warranty obligations apply only to defects caused by the fault of the manufacturer. Warranty service is performed by the manu-
facturer or an authorized service center.
Date of sale____________________ seller________________________________________
Familiar with the instructions and operating rules ____________________________
Версия документа от 19.07.2022
(store name or stamp)
(buyer’s signature)
2425
Arinst SSA-TG R3 portable spectrum analyzer with tracking generator
Manual. Passport products.
1. Purpose
Arinst SSA-TG R3 is a portable panoramic spectrum analyzer with a built-in tracking generator and demodulator de-
signed to display the spectral components of signals in the frequency range from 24 MHz to 12 GHz. High scanning
speed makes it possible to detect impulse signals of digital communication standards: Wi-Fi, 2G, 3G, 4G, LTE, CDMA,
DCS, GSM, GPRS, GLONASS, etc. The built-in tracking generator allows you to measure the frequency response of
passive or active devices, such as filters, amplifiers. Software demodulator of WFM/FM/AM signals is intended for
listening to the air and tuning analog radio transmitters. Setting the regional coverage frequencies of cellular operators
allows you to match the displayed signal with the corresponding operator. For convenience, the built-in software of the
device allows you to sign and highlight frequency ranges on the screen. For example, sign the names of radio stations,
Wi-Fi channels or frequency bands of mobile operators.
2. Device structure
Due to the constant improvement of the device and software, the manufacturer reserves the right to make
changes to its technical characteristics and completeness.
Kroks Plus LLC
394005, Voronezh, Moskovsky pr. 133-263
+7 (473) 290-00-99
info@kroks.ru
www.kroks.ru
1. Tracking generator output (TG OUT)
2. Headphone jack
3. Analyzer input (RF IN)
4. Touch screen
5. Status LED
6. On/off button
7. Battery charging LED
8. Mini-USB connector
9. Connector for external power supply
10. Speaker
Техническая документация:
- Паспорт. Анализатор спектра ARINST SSA-TG R3
Arinst SSA-TG R3 – это портативный панорамный анализатор спектра со встроенным трекинг-генератором и демодулятором, предназначен для отображения спектральных составляющих сигналов в диапазоне частот от 24 МГц до 12 ГГц. Высокая скорость сканирования дает возможность обнаруживать импульсные сигналы цифровых стандартов связи: Wi-Fi, 2G, 3G, 4G, LTE, CDMA, DCS, GSM, GPRS, ГЛОНАСС и т.д. Встроенный следящий генератор позволяет проводить измерения АЧХ пассивных или активных устройств, например, фильтров, усилителей. Программный демодулятор ШЧМ/ЧМ/АМ сигналов предназначен для прослушивания эфира и настройки аналоговых радиопередатчиков. Установка региональных частот покрытия сотовых операторов позволяет сопоставлять отображаемый сигнал с соответствующим оператором.
Для удобства работы встроенное ПО прибора позволяет подписывать и выделять цветом на экране частотные диапазоны. Например, подписать названия радиостанций, каналы WiFi или диапазоны частот мобильных операторов.
Для кого?
Анализатор спектра ARINST SSA-TG R3 предназначен в первую очередь для полевых работ, он имеет малые вес, размеры и отличается невысоким энергопотреблением. С его помощью сервисные центры и ремонтные бригады могут на месте провести ВЧ-анализ для проведения пуско-наладочных или ремонтных работ. Кроме этого, анализатор спектра идеально подходит для ремонтных мастерских и радиолюбителей.
С помощью прибора можно выполнить следующие работы:
- навести внешнюю антенну на базовую станцию
- провести экспресс-анализ радиочастотной обстановки
- проверить правильность работы репитера сотовой связи
- провести ремонт и настройку репитера, генератора, фильтра
- настроить радиопередатчик с аналоговой модуляцией
Как работает?
Прибор построен на основе супергетеродинного переноса спектра на нулевую промежуточную частоту, содержит высокопроизводительный микропроцессор, осуществляющий цифровую обработку сигналов. С его помощью удалось достичь высокой скорости сканирования до 20 ГГц/с и разрешения по частоте до 2,5 кГц, а так же реализовать программную демодуляцию аналоговых сигналов. Для расширения динамического диапазона входных сигналов в анализаторе установлены малошумящий усилитель и аттенюатор с фиксированным значением. Встроенный трекинг (следящий) генератор с регулировкой выходной мощности позволяет производить измерения кабелей, фильтров и т.д.
Преимущества анализатора спектра ARINST SSA-TG R3:
- наличие цветного сенсорного IPS дисплея с диагональю 4 дюйма
- широкий диапазон частот: от 24 МГц до 12 ГГЦ
- высокая скорость сканирования: до 20 ГГц/с
- встроенный трекинг-генератор (следящий генератор)
- программный демодулятор ШЧМ/ЧМ/АМ
- встроенный динамик
- разъем аудио 3,5мм для подключения наушников
- полный динамический диапазон с учетом МШУ и аттенюатора 125 дБ
- отображение региональных распределений частот
- настраиваемые темы отображения
- зарядка от mini-USB или от внешнего блока питания с напряжением 7- 24 В
- малый вес и размеры: вес 400 г, размеры 145х81х27 мм
- автономная работа до 4 часов
Ограничения
Анализатор спектра Arinst SSA-TG R3 не является измерительным прибором, так как не имеет утвержденного типа средства измерений. Утверждение типа средства измерений негативно повлияло бы на доступность и цену прибора. Поэтому анализатор спектра с официальной точки зрения является индикатором поля. Однако, несмотря на это, прибор полностью соответствует всем заявленным техническим характеристикам. Анализатор не является полноценным классическим анализатором спектра, поскольку не использует классическую схему преобразования частот для 100% подавления зеркального канала. Мы используем математическое подавление зеркального канала, что в отдельных редких случаях может приводить к появлению в составе отображаемых сигналов «фантомных» сигналов.
| ТЕХНИЧЕСКИЕ ХАРАКТЕРИСТИКИ ARINST SSA-TG R3: | |
|---|---|
| Частотный диапазон | |
| Отображаемый диапазон частот1 | 24 МГц — 12 ГГц |
| Измеряемый диапазон частот | 24 МГц — 9 ГГц |
| Максимальная полоса обзора | ~12 ГГц |
| Опорный генератор TXCO GPS | 26 МГц |
| Разрешение по частоте | 25, 10, 5, 2.5 кГц |
| Полка шума2 | |
| в полосе 24 МГц — 6.2 ГГц | -110 дБм |
| в полосе 6.2 ГГц — 9 ГГц | -100…-70 дБм |
| в полосе 9 ГГц – 12 ГГц | -70 дБм |
| Параметры сканирования3 | |
| Максимальная скорость сканирования | 20 ГГц/с |
| Минимальное время обзора полной полосы частот 12 ГГц | 0.6 с |
| РЧ вход | |
| Усиление при включенном аттенюаторе | -15 дБ |
| Усиление при включенном малошумящем усилителе | +15 дБ |
| Волновое сопротивление | 50 Ом |
| КСВ в рабочем диапазоне частот | < 2.0 |
| Максимальная входная мощность при выключенном аттенюаторе и МШУ | 0 дБм |
| Максимальная входная мощность при включенном аттенюаторе | +15 дБм |
| Максимальная входная мощность при включенном МШУ | -15 дБм |
| Максимальное постоянное напряжение на входе | 25 В |
| Трекинг генератор | |
| Режимы измерений | фиксированная, S21 |
| Нормированный уровень выходной мощности в полосе 24-6200 МГц | -8 дБм : — 29 дБм |
| Нормированный уровень выходной мощности в полосе 6200-9000 МГц | -14 дБм |
| Глубина регулировки мощности в полосе 24-6200 МГц | 21 дБ |
| Шаг регулировки мощности в полосе 24-6200 МГц | 3 дБ |
| Демодулятор | |
| Типы демодуляции | ШЧМ, ЧМ, АМ |
| Функции | АРУ, S-метр, пороговый шумоподавитель |
| Полосы для ШЧМ | 400, 300, 200, 100 кГц |
| Полосы для ЧМ, АМ | 20, 10, 8, 6, 4 кГц |
| Аудио выход | Динамик 2 Вт, наушники |
| Отображение | |
| Тип экрана | сенсорный резистивный, IPS |
| Разрешение экрана | 800×480 |
| Графики | спектр, водопад, S21 |
| Питание | |
| Ёмкость встроенного аккумулятора | 5000 мАч |
| Время непрерывной работы от аккумулятора | ~ 4 ч |
| Время заряда аккумулятора4 | ~ 3.5 ч |
| Интерфейс подключения к ПК | USB |
| Внешний блок питания | 7-24 В, 2 А |
| Рабочий диапазон температур | 0 … +40°С |
| Габаритные размеры (Д×Ш×В) | 145x81x27 мм |
| Масса | 0,4 кг |
- В диапазоне отображения не гарантируются точностные параметры сигналов.
- Уровень шумовой полки измеряется при включенном МШУ и спектральном разрешении 2.5 кГц.
- Измерения проводятся при режиме работы «Скорость» и спектральном разрешении 25 кГц.
-
Источник должен обеспечивать мощность не менее 7 Вт.
07-07-2022
|
Габариты (длина , ширина , высота ), мм |
250 x 250 x 100 |
Антенны- характеристики :
|
Рабочий диапазон частот, МГц |
1700-2700 |
|
Усиление антенны, дБ |
12-15 |
|
КСВ в рабочем диапазоне частот, не более |
1.7 |
|
Входное сопротивление, Ом |
50 |
|
Максимальная подводимая мощность, Вт |
10 |
|
Допустимая ветровая нагрузка, м/с |
30 |
|
Диапазон рабочих температур, оС |
-40 … +50 |
|
Максимально допустимая влажность воздуха, % |
100 |
|
Кроссполяризационная развязка не менее, дБ |
30 |
|
Стандарт связи |
4G(LTE2600), YOTA |
|
Тип исполнения |
направленная |
Графики КСВ, диаграммы направленности:
Комплектация:
Хомут для крепления к трубе
04-07-2018
-
Contents
-
Table of Contents
-
Bookmarks
Quick Links
SCIENTIFIC AND PRODUCTION COMPANY
PORTABLE SPECTRUM ANALYZER
WITH BUILT-IN SIGNAL GENERATOR
Arinst SSA-TG R2
USER MANUAL
Article 1484
Related Manuals for Kroks Arinst SSA-TG R2
Summary of Contents for Kroks Arinst SSA-TG R2
-
Page 1
SCIENTIFIC AND PRODUCTION COMPANY PORTABLE SPECTRUM ANALYZER WITH BUILT-IN SIGNAL GENERATOR Arinst SSA-TG R2 USER MANUAL Article 1484… -
Page 2: Table Of Contents
Portable spectrum analyzer Arinst SSA-TG R2 6 April 2019 CONTENT 1. PURPOSE …………………………4 2. SPECIFICATIONS ………………………. 4 3. COMPLETENESS ……………………….. 5 4. SAFETY RULES FOR OPERATING THE DEVICE ……………… 5 4.1. General safety requirements ………………….5 4.2. Additional security requirements ………………….5 5.
-
Page 3
Portable spectrum analyzer Arinst SSA-TG R2 6 April 2019 8.8. Menu of automatic measurements of extreme signal values …………34 8.9. Processing of displayed measurement results…………….. 38 8.10. Settings menu ……………………..43 8.11. Download and save data menu …………………. 44 8.12. -
Page 4: Purpose
6 April 2019 1. PURPOSE 1.1. Portable spectrum analyzer ARINST SSA-TG R2 with build-in signal generator (further the ana- lyzer, the device) designed to display the spectrums of signals in the frequency range from 35 to 6200 MHz. The device displays the spectrums of signals of all modern technologies: Wi-Fi, 2G, 3G, 4G, LTE, CDMA, DCS, GSM, GPRS, GLONASS, etc.
-
Page 5: Completeness
Portable spectrum analyzer Arinst SSA-TG R2 6 April 2019 3. COMPLETENESS 3.1. The delivery set of the device is presented in table 2 and in figure 1. Table 2 Name Amount Spectrum analyzer ARINST SSA-TG R2 1 pc. Adapter SMA(male)-SMA(female) 2 pc.
-
Page 6: Structure Of The Device
Portable spectrum analyzer Arinst SSA-TG R2 6 April 2019 4.2.10. Do not allow children to play with the device, as they hurt or injure others, or damage the device. 4.2.11. Use chargers, cords, adapters and other accessories recommended by the manufacturer.
-
Page 7: Activation
Portable spectrum analyzer Arinst SSA-TG R2 6 April 2019 6. ACTIVATION Attention! The use of the device in open spaces during snowfall or rain is prohibited. If the de- vice is brought in the winter from a cold room, or from the street into a warm room, do not turn it on for a time sufficient to evaporate condensate from the device.
-
Page 8: Main Menu
Portable spectrum analyzer Arinst SSA-TG R2 6 April 2019 7.1.2. At the bottom of the screen is an information label, which displays the current settings of the de- vice and the parameters of the frequency range of the review, the analyzed signal.
-
Page 9: Setting The Frequency Range Of The Analyzed Signal
Portable spectrum analyzer Arinst SSA-TG R2 6 April 2019 Device — in this menu, the device shutdown timer, amplitude and frequency shift are set, the serial number of the device, its version and the settings for connecting the device via Bluetooth are specified.
-
Page 10: Setting The Main Parameters Of The Amplitude Of The Analyzed Signal
Portable spectrum analyzer Arinst SSA-TG R2 6 April 2019 7.3.4. In the analysis of wide frequency ranges (Span) more than 40 MHz, to reduce the analysis time, the frequency scan is performed with a maximum step. In this case, the error in measuring the signal power can reach 6 dB.
-
Page 11: Menu For Setting Markers And Signal Peaks
Portable spectrum analyzer Arinst SSA-TG R2 6 April 2019 7.4.4. The level of attenuation of the input signal (the value of the internal attenuator) is set automati- cally, depending on the set value Reference amplitude. Attention! If the input signal level is much higher than the Reference amplitude value, a warning message Dynamic range exceeded appears on the device screen.
-
Page 12: Signal Generator Frequency And Power Setting Menu
Portable spectrum analyzer Arinst SSA-TG R2 6 April 2019 igure 11 Entering numerical values of marker frequencies 7.5.4. Moving the included markers on the screen in real time, make in accordance with paragraph 7.1.5. of this «Manual». 7.5.5. If it is necessary to search and track the maximum (peak) amplitude values over the entire range of the signal under analyze, one or several Marker indicators must be switched to the Peak value as shown in figure 12.
-
Page 13
Portable spectrum analyzer Arinst SSA-TG R2 6 April 2019 igure 13 Switching on the internal signal generator 7.6.2. To turn on the internal output generator, move the “slider” across the screen to the right. On the screen will open the window for setting the frequency of the Generator Frequency and the power of the Generator Power of the generator output signal, as in Figure 14. -
Page 14
Portable spectrum analyzer Arinst SSA-TG R2 6 April 2019 igure 15 Entering the numerical value of the frequency of the output signal of the generator 7.6.4. Depending on the equipment to which the generator output signal is applied, set the signal pow- er value in the range from -15 to -25 dBm. -
Page 15
Portable spectrum analyzer Arinst SSA-TG R2 6 April 2019 igure 17 Determination of the amplitude-frequency characteristics of the equipment under test Note. When determining the frequency response of active and passive devices, it is recommended to use cables with a high screening coefficient. This will ensure minimization of the parasitic transmission of electromagnetic energy from one port of the device to another port. -
Page 16: Setting Parameters And Measuring The Reflection Coefficient S11
(14) «MENU». 7.7. Setting parameters and measuring the reflection coefficient S11 Our device ARINST SSA-TG R2, in the measurement mode of the S11 parameter, uses a scalar SOL calibration. And these measurements are not vector, that is, they provide compensation only for the amplitude of the signal without phase.
-
Page 17
Portable spectrum analyzer Arinst SSA-TG R2 6 April 2019 the KROKS KSB 2700 measuring bridge is specifically designed for use with ARINST spectrum analyz- ers. 7.7.4. Select the mode S11 in which you want to measure, as shown in figure 18. On the screen under the grid, the information label will display the mode S11 and the warning UNCAL (not calibrated). -
Page 18: Setting Parameters And Measuring The Standing Wave Ratio Swr
Portable spectrum analyzer Arinst SSA-TG R2 6 April 2019 igure 20 Display of the reflection coefficient graph Note. After calibration, the setting of the frequency range at which the reflection coefficient is investi- gated is unavailable in S11 mode. Set the frequency range of the signal under study before calibration.
-
Page 19
Note. To measure the standing wave ratio, you must use a directional coupler or measuring bridge (not included in the package). In our example in figure 19, the KROKS KSB 2700 measuring bridge is specifi- cally designed for use with ARINST spectrum analyzers. -
Page 20: Device Control Menu With Using External Attenuators Or Frequency Converters
Portable spectrum analyzer Arinst SSA-TG R2 6 April 2019 7.9. Device control menu with using external attenuators or frequency converters 7.9.1. To insert correction of frequency or amplitude when using external attenuators or frequency converters, go to the main menu (figure 6) by pressing the «MENU» button (14) and select the Device subsection.
-
Page 21: Custom Settings Menu
Portable spectrum analyzer Arinst SSA-TG R2 6 April 2019 Setting the value of the shift of the input signal frequency Freq. shift, is made by entering a numerical value in the submenu that opens, as in figure 24. Enter the numerical value of the frequency and press Enter.
-
Page 22
Portable spectrum analyzer Arinst SSA-TG R2 6 April 2019 Figure 26 Custom settings menu 7.10.2. The device allows you to save up to four user settings. To save the settings, click on the image of the floppy disk. A display of your settings will appear in the field to the left of the diskette (the range of the scanned frequencies, the frequency of the internal signal generator, settings for measuring the fre- quency response and SWR). -
Page 23: The Interface Of The Program Control Device, With Devices
Portable spectrum analyzer Arinst SSA-TG R2 6 April 2019 THE INTERFACE OF THE PROGRAM CONTROL DEVICE, WITH DEVICES BASED ON THE ANDROID OPERATING SYSTEM 8.1. External device requirements 8.1.1. For reliable and stable connection to the device, devices managed by the Android operating sys- tem must meet the following requirements: — Android operating system version 4.1 and higher;…
-
Page 24: Main Menu Of The Control Program
Portable spectrum analyzer Arinst SSA-TG R2 6 April 2019 Figure 28 Message about connecting the device to the tablet / smartphone 8.2.7. The screen of the tablet / smartphone is grafted by a large-scale grid consisting of horizontal and vertical lines. The horizontal axis is calibrated in frequency, which increases linearly from left to right. The vertical axis is calibrated in amplitude.
-
Page 25: Management Features
Portable spectrum analyzer Arinst SSA-TG R2 6 April 2019 8.3.2. Each section of the main menu has its own purpose: Frequency – control of the operating frequency range of the analyzed signal; Amplitude – control of the operating range of amplitude parameters;…
-
Page 26
Portable spectrum analyzer Arinst SSA-TG R2 6 April 2019 Presets – load custom settings; Regions – tab to control the marking of frequency ranges and assign names to them. 8.5.3. Setting each of the parameters is performed by entering numerical values in the opened sub- menu, as in figure 31. -
Page 27
Portable spectrum analyzer Arinst SSA-TG R2 6 April 2019 igure 32 Loading user settings of frequency parameters 8.5.6. In the Presets tab, select the pre-saved installation and click Load. To refuse to download the pre-installation, click Cancel. To save the new setting, click Save. To remove all user settings, press Re- set to default (return to factory settings). -
Page 28
Portable spectrum analyzer Arinst SSA-TG R2 6 April 2019 Figure 34 Regions menu 8.5.10. In this menu you can set: Show regions – control of displaying of markings of the ranges and their names; Region presets – custom installation of the markings of the frequency bands;… -
Page 29: Amplitude Parameters Control Menu
Portable spectrum analyzer Arinst SSA-TG R2 6 April 2019 8.6. Amplitude parameters control menu 8.6.1. From the main menu of the control program, enter the amplitude parameters control menu Am- plitude (Figure 36). Figure 36 Amplitude scale control menu 8.6.2. To control the vertical scale — the amplitude scale, the following parameters are used: Ref level –…
-
Page 30
Portable spectrum analyzer Arinst SSA-TG R2 6 April 2019 Figure 37 Entering the maximum displayed signal amplitude value 8.6.4. Setting the maximum displayed amplitude can be done by directly moving the amplitude scale up and down, with a finger on the screen of the tablet/smartphone. -
Page 31: Working In Marker Measurements Menu
Portable spectrum analyzer Arinst SSA-TG R2 6 April 2019 8.7. Working in marker measurements menu 8.7.1. From the main menu of the control program, enter the menu for selecting the marker measure- ments type Markers (figure 39). igure 39 Menu for selection of marker measurements type 8.7.2.
-
Page 32
Portable spectrum analyzer Arinst SSA-TG R2 6 April 2019 igure 40 Entering the value of a fixed marker frequency 8.7.4. If the exact setting of the marker frequency is not required, you can set the marker by double- clicking on the tablet / smartphone screen. To change the position of the marker, you need to click on it, wait about a second and move it around the screen of the tablet / smartphone by changing its fixed fre- quency. -
Page 33: Portable Spectrum Analyzer Arinst Ssa-Tg R2 6 April
Portable spectrum analyzer Arinst SSA-TG R2 6 April 2019 igure 42 Displaying the label designation of markers igure 43 Placement of the designation of markers in the form of a table 8.7.7. To select one of four types of marker measurements of a signal, enter the Type menu. Select one of the signal measurement types, as shown in Figure 44.
-
Page 34: Menu Of Automatic Measurements Of Extreme Signal Values
Portable spectrum analyzer Arinst SSA-TG R2 6 April 2019 igure 44 Selecting the type of marker measurement signal Normal – measurement of the absolute values of the amplitudes; Delta (amp) – measurement of amplitude difference between two markers – basic and additional;…
-
Page 35
Portable spectrum analyzer Arinst SSA-TG R2 6 April 2019 igure 46 Automatic setting of the marker to the maximum value of the signal 8.8.3. If you need to track the level and frequency of the maximum signal value, turn on the option to cycle the search for the maximum signal value Continuous, as shown in Figure 47. -
Page 36
Portable spectrum analyzer Arinst SSA-TG R2 6 April 2019 igure 48 Automatic installation of the maximum signal marker in the center of the screen 8.8.5. If you need to monitor a signal with a changing frequency, enable the Auto option as shown in figure 49. -
Page 37
Portable spectrum analyzer Arinst SSA-TG R2 6 April 2019 igure 50 Setting the required number of markers 8.8.7. After setting the required number of markers, go to the Multi peak menu and click the Run command, as shown in Figure 51. If necessary, use the cyclic repeat option Repeat. -
Page 38: Processing Of Displayed Measurement Results
Portable spectrum analyzer Arinst SSA-TG R2 6 April 2019 igure 52 Cyclic tracking of signal peak values 8.9. Processing of displayed measurement results 8.9.1. From the main menu of the control program, enter the menu of statistical and mathematical pro- cessing of the displayed data Trace, as shown in Figure 53.
-
Page 39
Portable spectrum analyzer Arinst SSA-TG R2 6 April 2019 Figure 54 Spectrum scanning suspended 8.9.4. First, you need to select the type of measurement accumulation, as in Figure 55 Normal – single data accumulation mode according to the specified number of scans;… -
Page 40
Portable spectrum analyzer Arinst SSA-TG R2 6 April 2019 Figure 56 Setting the number of measurements 8.9.6. To restart the scan, press the Restart button, to stop the scan, press the Stop button, in the up- per right corner of the tablet/smartphone screen, figure 57. -
Page 41
Portable spectrum analyzer Arinst SSA-TG R2 6 April 2019 igure 58 Setting the number of scans to display peaks 8.9.8. Min Hold mode allows you to display the minimum measurement results for multiple scans. Use the «-» and «+» buttons to set the required number of scans (in the range from 4 to ∞) and click the Run command, Figure 59. -
Page 42
Portable spectrum analyzer Arinst SSA-TG R2 6 April 2019 igure 60 Setting the number of scans to display maximums and minimums 8.9.10. Figure 61 shows the operation in the display mode of the maximum and minimum measure- ment result. The red graph shows the maximum averaged measurement result. The minimum averaged measurement result is displayed in green graph. -
Page 43: Settings Menu
Portable spectrum analyzer Arinst SSA-TG R2 6 April 2019 8.10. Settings menu 8.10.1. From the main menu of the control program, enter the Settings menu, as shown in Figure 62. Figure 62 Settings menu 8.10.2. To set the interface language, click on the Language button, and in the appeared window se- lect the interface language of the control program, figure 63.
-
Page 44: Download And Save Data Menu
Portable spectrum analyzer Arinst SSA-TG R2 6 April 2019 8.11. Download and save data menu 8.11.1. From the main menu of the control program, enter the menu to load and save data File. As shown in figure 64. In the File menu, you can save files (Save) with data, frequency bands, etc., to down- load frequency bands and data from the memory card of your tablet/smartphone Figure 64 –…
-
Page 45: Information About The Control Program
Portable spectrum analyzer Arinst SSA-TG R2 6 April 2019 8.13. Information about the control program 8.13.1. From the main menu of the control program, enter the About menu, which contains information about the software version, software version of the device and the device number, figure 66. To check the availability of a new software version of the device, click the Check for update button.
-
Page 46: Examples Of Use Of The Device
Portable spectrum analyzer Arinst SSA-TG R2 6 April 2019 EXAMPLES OF USE OF THE DEVICE 9.1. Setting the internal oscillator output frequency and power 9.1.1. From the main menu of the control program, enter the Generator menu, as shown in figure 67.
-
Page 47: Determination Of Amplitude-Frequency Response
Portable spectrum analyzer Arinst SSA-TG R2 6 April 2019 igure 68 Graph of the signal spectrum of the internal generator 9.2. Determination of amplitude-frequency response Attention! If the output power of the measured device is not known, always set the maximum value of the internal attenuator of the device! 9.2.1.
-
Page 48
Portable spectrum analyzer Arinst SSA-TG R2 6 April 2019 9.2.2. In the frequency characteristic setup menu Frequency, set the frequency range of the Span and Center frequency. Note. When determining the frequency response of active and passive devices, it is recommended to use cables with a high screening coefficient. -
Page 49: Reflection Coefficient Measurement
Portable spectrum analyzer Arinst SSA-TG R2 6 April 2019 normalization operation and connect the test device to the circuit. If necessary, reduce the attenuation value of the attenuator. Note. If you change the external attenuator, perform the normalization operation again.
-
Page 50
Note. To measure the reflection coefficient S11, you must use a directional coupler or measuring bridge (not included). In our example in figure 19, the KROKS KSB 2700 measuring bridge is specifically designed for use with ARINST spectrum analyzers. -
Page 51: Measurement Of Standing Wave Ratio (Swr)
Portable spectrum analyzer Arinst SSA-TG R2 6 April 2019 Figure 73 Calibration in mode S11 Connect the test equipment (DUT) to the TEST port of the measuring bridge and measure the reflec- tion coefficient. Note. The reflection coefficient S11 will be displayed in a logarithmic grid with vertical axis in dB. The horizontal axis displays the specified frequency range of the signal, figure 74.
-
Page 52
Note. To measure the standing wave ratio SWR, you must use a directional coupler or measuring bridge (not included). In our example in figure 19, the KROKS KSB 2700 measuring bridge is specifically designed for use with ARINST spectrum analyzers. -
Page 53
Portable spectrum analyzer Arinst SSA-TG R2 6 April 2019 Figure 76 – Calibration in SWR mode After calibration, the Open calibration, Short calibration, and Load calibration commands change to the cancel commands: Reset open calibration; Reset short calibration and Reset load calibration. -
Page 54: Displaying Multiple Frequency Bands Of Signals
Portable spectrum analyzer Arinst SSA-TG R2 6 April 2019 9.5. Displaying multiple frequency bands of signals 9.5.1. To simultaneously display several frequency bands on the tablet / smartphone screen, enter the frequency range operating menu Frequency, and select the Frequency merges tab, figure 78.
-
Page 55
Portable spectrum analyzer Arinst SSA-TG R2 6 April 2019 Note. By default, the new lists of frequency ranges are automatically assigned the name «merge» with an indication of the sequence number. For example, merge003. Figure 80 Entering the name of the new range list 9.5.4. -
Page 56
Portable spectrum analyzer Arinst SSA-TG R2 6 April 2019 b) By directly entering the frequency range. To do this, click Add frequency band (figure 80), and in the menu that opens, enter the Start and Stop frequency of the range, as shown in figure 82. In our ex- ample, the frequency range UMTS-FDD Downlink is introduced. -
Page 57
Portable spectrum analyzer Arinst SSA-TG R2 6 April 2019 9.5.6. To edit the list of frequency ranges (add new ranges or delete existing ones), click Edit, to close the tab, click Close. To display frequency graphs from the created list of bands on the tablet / smartphone screen, click Load. -
Page 58: Pointing Of Antennas Using The Device
Portable spectrum analyzer Arinst SSA-TG R2 6 April 2019 Figure 86 Display of frequency graphs from the list of ranges on the screen 9.6. Pointing of antennas using the device 9.6.1. In the process of installation of antennas with high gain, it is necessary to pay increased atten- tion to the accuracy of pointing the antenna to the base station.
-
Page 59
Portable spectrum analyzer Arinst SSA-TG R2 6 April 2019 igure 87 Setting the frequency range from the range list or by entering the initial Start and final Stop frequency range, as in figure 88. igure 88 Entering the frequency range of the signal overview 9.6.4. -
Page 60
Portable spectrum analyzer Arinst SSA-TG R2 6 April 2019 igure 89 Setting the number of scans for maximum display 9.6.5. On the tablet / smartphone screen, the average maximum signal level will be displayed in red, figure 90. igure 90 Displaying the maximum signal level 9.6.6. -
Page 61: Care And Maintenance
Portable spectrum analyzer Arinst SSA-TG R2 6 April 2019 CARE AND MAINTENANCE 10.1. General care of the device 10.1.1. When working with the device, use the supplied adapters to protect the high-frequency con- nectors of the device from excessive wear.
-
Page 62
Portable spectrum analyzer Arinst SSA-TG R2 6 April 2019 Figure 91 New battery for the device Attention! To replace the battery, you will need to disassemble the device. Make sure you have the tools, knowledge, and skills you need to repair the instrument yourself. In case of lack of ex- perience and qualification, contact specialists with appropriate qualifications. -
Page 63: Storage And Transportation
Portable spectrum analyzer Arinst SSA-TG R2 6 April 2019 Figure 93 Battery replacement 10.3.8. Apply a new double sided tape and attach a new battery (20) securely to it. Connect the battery connector (19) to the connector on the board. Reassemble the instrument in reverse order.
-
Page 64: Possible Malfunctions And Methods Of Their Elimination
Portable spectrum analyzer Arinst SSA-TG R2 6 April 2019 POSSIBLE MALFUNCTIONS AND METHODS OF THEIR ELIMINATION If a malfunction occurs, check the possible causes of the fault in table 3. Table 3 Fault Possible reason Method of elimination Low battery.
-
Page 65: Warranty Obligations
Portable spectrum analyzer Arinst SSA-TG R2 6 April 2019 WARRANTY OBLIGATIONS The company «Kroks Plus» guarantees conformity of this product with technical characteristics given in this document. The warranty period is 12 months from the date of sale. During this period, the manufacturer pro- vides free warranty service.
-
Page 66: Application A. Connecting The Arinst Ssa Spectrum Analyzer To Devices Running The Windows Operating System
Portable spectrum analyzer Arinst SSA-TG R2 6 April 2019 APPLICATION A (referential) Connecting the Arinst SSA spectrum analyzer to devices running the WINDOWS operating system 1. Requirements for devices 1.1. For a reliable and stable connection to a spectrum analyzer, devices managed by the Windows operating system must meet the following requirements: …
-
Page 67
Portable spectrum analyzer Arinst SSA-TG R2 6 April 2019 Figure A2 – Saving the downloaded software file 2.3. Enter the directory into which the compressed (archive) file was uploaded and unzip it with the help of archiving programs (Figure A3). -
Page 68
Portable spectrum analyzer Arinst SSA-TG R2 6 April 2019 Figure A4 — Installing the Arinst SSA Application 2.5. When the installation is complete, close the dialog window by clicking Close. On the desktop of your PC will be a shortcut to start the application Arinst SSA. -
Page 69
Portable spectrum analyzer Arinst SSA-TG R2 6 April 2019 2.7. Double-click on the driver file corresponding to your Windows operating system. The device driver installation wizard will start (Figure A6). To continue the installation, click the Next button. To cancel the installation, click Cancel. -
Page 70
Portable spectrum analyzer Arinst SSA-TG R2 6 April 2019 3.3. In the Arinst SSA application window that opens, click on the USB connection symbol located in the upper right corner. In the Devices window that appears, select the created virtual port for connecting your device (Figure A7). -
Page 71
Portable spectrum analyzer Arinst SSA-TG R2 6 April 2019 3.6. When finished, turn off the spectrum analyzer by pressing the button (5) POWER. Disconnect the USB cable from the spectrum analyzer and from the PC. Figure A9 — Spectrum analyzer connected to PC via USB cable 4. -
Page 72
Portable spectrum analyzer Arinst SSA-TG R2 6 April 2019 To do this, click the Start button and select Settings → Devices. Move the power-on slider of Bluetooth-installed devices to the PC. (Enabled). Then click Add Blue- tooth or another device (Figure A10). -
Page 73
Portable spectrum analyzer Arinst SSA-TG R2 6 April 2019 In our example in Figure A13, the spectrum analyzer displayed as ARINST_SSA_UNV_3997 is con- nected to the PC. Figure A13 — Connecting the spectrum analyzer to a PC 4.6. Launch the Arinst SSA application by double-clicking on the shortcut located on the desktop of your PC. -
Page 74
Portable spectrum analyzer Arinst SSA-TG R2 6 April 2019 4.7. Clicking on the name of the spectrum analyzer connected to the application (in our example it is ARINST_SSA_UNV_3997) close the Devices window. The device will connect to the PC via Bluetooth data transfer protocol.