Installation
Install Selenium IDE from either the Chrome or Firefox web store.
Launch the IDE
Once installed, launch it by clicking its icon from the menu bar in your browser.
Troubleshooting
Don’t see the icon for Selenium IDE in your menu-bar?
Option 1
Make sure the IDE is enabled in your browser’s extension settings.
You can get there quickly by typing the following into your address bar and hitting Enter.
- Chrome:
chrome://extensions - Firefox:
about:addons
Option 2
The extension might be enabled but the icon is hidden. Try resizing the menu bar to give it more space.
In Chrome, you can do this by clicking to the right of the address bar, holding the click, and dragging it left or right.
In Firefox you need to right-click, click Customize, make adjustments to the menu bar, and click Done.
Welcome Screen
Upon launching the IDE you will be presented with a welcome dialog.
This will give you quick access to the following options:
- Record a new test in a new project
- Open an existing project
- Create a new project
- Close the IDE
If this is your first time using the IDE (or you are starting a new project), then select the first option.
Recording your first test
After creating a new project you will be prompted to name it and then asked to provide a base URL. The base URL is the URL of the application you are testing. It’s something you set once and it gets used across all of the tests in this project. You can change it later if need-be.
After completing these settings, a new browser window will open, load the base URL, and start recording.
Interact with the page and each of your actions will be recorded in the IDE. To stop recording, switch to the IDE window and click the recording icon.
Organizing your tests
Tests
You can add a new test by clicking the + symbol at the top of left side-bar menu (to the right of the Tests heading), naming it, and clicking ADD.
Once added you can either input commands manually, or click the record icon in the top-right of the IDE.
Suites
Tests can be grouped together into suites.
On project creation, a Default Suite gets created and your first test gets added to it automatically.
To create and manage suites go to the Test suites panel. You can get there by clicking the drop-down at the top of the left side-bar menu (e.g., click on the word Tests) and selecting Test suites.
Add a suite
To add a suite, click the + symbol at the top of the left side-bar menu to the right of the Test Suites heading, provide a name, and click ADD.
Add a test
To add a test to a suite hover over the suite name, then do the following:
- Click on the icon that appears to the right of the
Test Suitesheading - Click
Add tests - Select the tests you want to add from the menu
- Click
Select
Remove a test
To remove a test, hover your mouse over the test and click the X that appears to the right of the name.
Remove or rename a suite
To remove a suite click the icon that appears to the right of its name, click Delete, and click Delete again when prompted.
To rename a suite hover over the suite name, click the icon that appears to the right of the name, click Rename, update the name, and click RENAME.
Save your work
To save everything you’ve just done in the IDE, click the save icon in the top-right corner of the IDE.
It will prompt you to for a location and name of where to save the project. The end result is a single file with a .side extension.
Playback
In-browser
You can play tests back in the IDE by selecting the test or suite you’d like to play and clicking the play button in the menu bar above the test editor.
The test(s) will play back in the browser. If a window is still open from recording, it will be used for playback. Otherwise, a new window will be opened and used.
Cross-browser
If you want to run your IDE tests on additional browsers, be sure to check out the command-line runner.

Selenium IDE Tutorial For Beginner
Selenium IDE Tutorial For Beginner
In this article we will go through the basic steps on how to install and use the Selenium IDE plugin for testing your website.
Article Agenda:
- Install the Selenium IDE
- Record your first test case
- run your first test case and see the results
- Create and edit test cases manually
- Save test cases & test suits
- Load & run test suits
- More About Target Locators
- More Commands
Install the Selenium IDE
The first thing you need to do is installing the Selenium IDE. The Selenium IDE is a plugin for Firefox which is not available in the add-ons manager. You need to download and install it manually.
Since you want to install a Firefox plugin, you should perform all of the following steps in your Firefox browser.
- First click to download/install the latest version of the Selenium IDE (2.9.0) here.Or go to http://www.seleniumhq.org/download/, scroll down to “Selenium IDE” and click on the link to download/install the latest released version.
- If your Firefox browser tells you, that it prevented the site to install software on your computer, click “allow”.
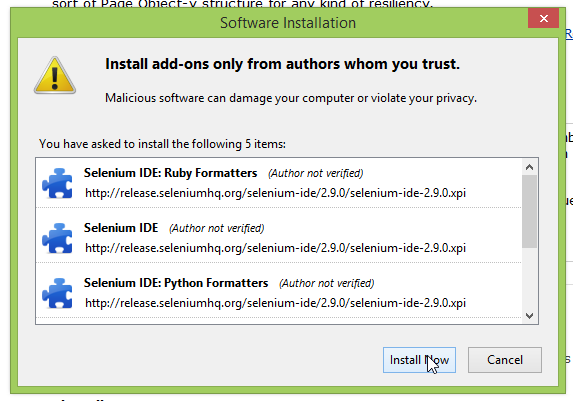
- When the next window “software installation” pops up, click on “install now” to install the different parts of the Selenium IDE.
- Restart your browser.
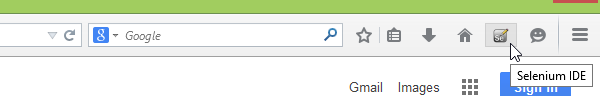
- Now you should see the icon of the Selenium IDE in your toolbar.
Record your first test case
- If you have not already, open your Firefox browser.
- Navigate to google.com. We will use this site for our sample test case.
- Click on the Selenium IDE icon in the toolbar.
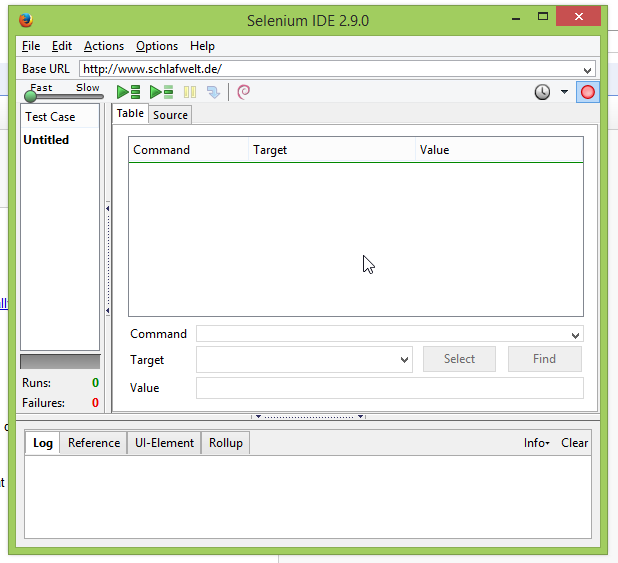
- The Selenium IDE opens and should look like this:
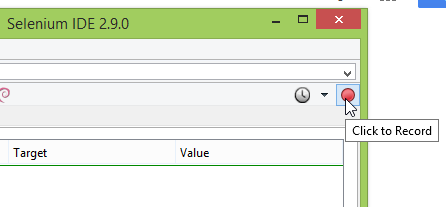
- If it is not activated already, click the record button to start recording your actions on the website.
- Now in the browser window, click in the search input field and type: “Selenium”
- Hit Enter
- Click on the first search result (“Selenium – Web Browser Automation”)
- Right-Click on the headline “What is Selenium?” to open the context menu.
- In the context menu go to “Show All Available Commands” > “assertText: css=h2 exact:What is Selenium?” and click on it.
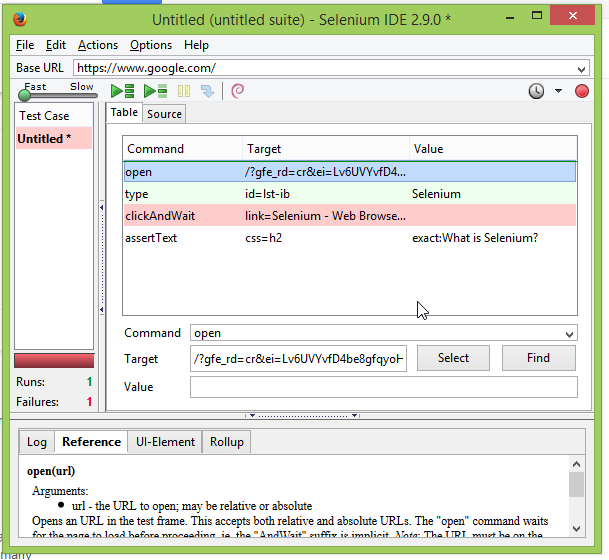
- Switch to the Selenium IDE window. It should now look something like this:

- Congrats: You recorded you first test case, which tests if the headline on the page of the first test result when you search at google.com for “Selenim” is “What is Selenium?”
Run your first test case and see the results
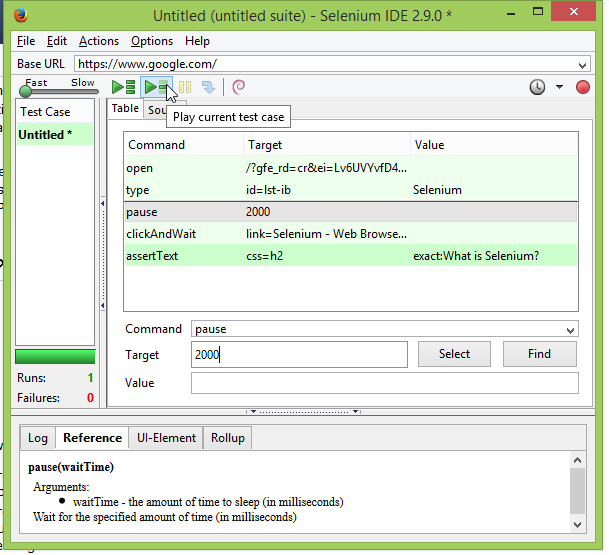
- You should still have the Selenium IDE open with the just recorded test case.
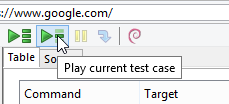
- Click the second green play button in the toolbar to play the current test case.
- Probably the test run will fail and look like this:
- So what is going wrong here? The second step that we recorded is to type in “Selenium”. The next step ist to click on the first search result. The Selenium IDE tries to perform the third step directly after the second step, but google.com needs a little time to load the search results before we can click on it. The Selenium IDE “thinks” that the desired link is not there and that is why the third step fails.
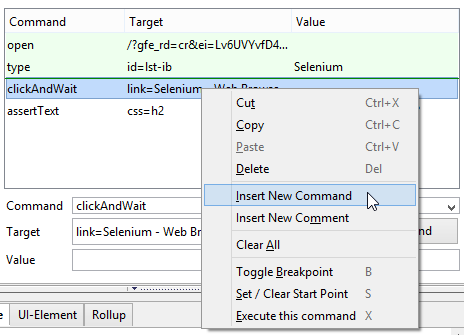
- Fix: We give Google a little time to load the search result before we click on it. To do this do a right click on the third command and in the context menu choose “Insert New Command”.
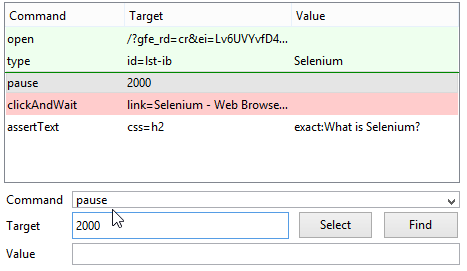
- Type (or select from the list) in the Command-Field “pause” and in the Target-Field 2000. That will pause the test execution for 2000 millisecond = 2 seconds. That should be plenty of time for Google to load the test results.
- Hit the play button again.
- The test case should pass now and the Selenium IDE should look something like this:
Creating Test Cases Manually
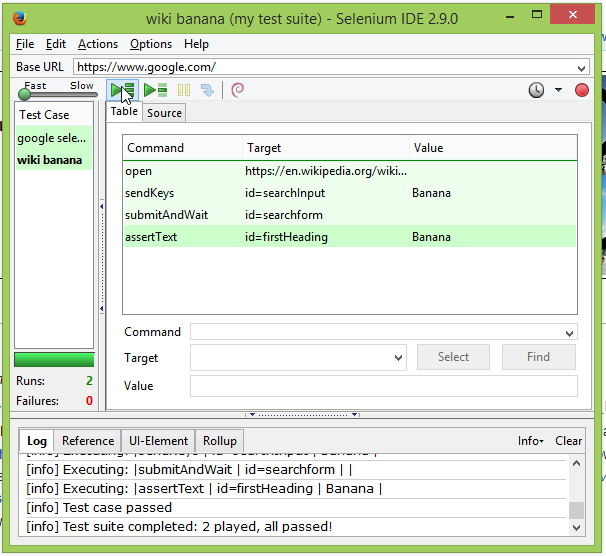
If you prefer not to record the single test steps but to define them manually, please read through the next example. We will Test if we can search on Wikipedia for “Banana” and if the Headline of the page is “Banana”.
To understand this part of the tutorial you will need a basic understanding of HTML!
- Creat a new test case by clicking on “File > New Test Case” (or pressing Ctrl + N).
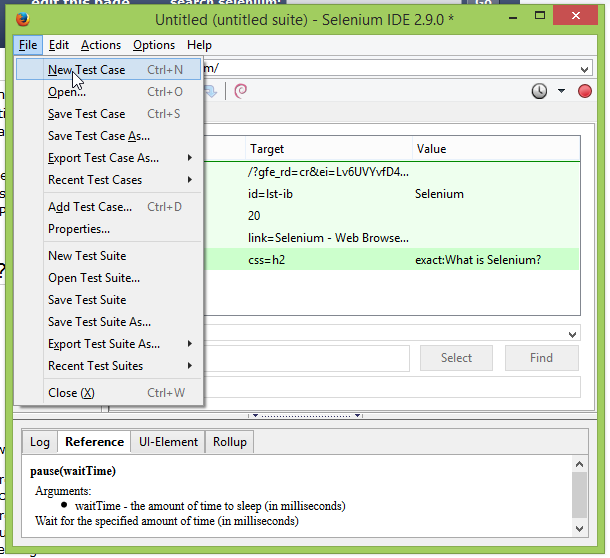
- Click in the first row and then type in the Command-Field: “open”. Type in the Target-Field: “https://en.wikipedia.org/wiki/Main_Page”
- After every command you add to the test case, you should hit the “Play current test case”-Button (the second green arrow) to see if your test case works so far.
- Click in the second row and type in the Command-Field or select from the Command-List: “sendKeys”
- Then, next to the Target-Field, click on “Select”.
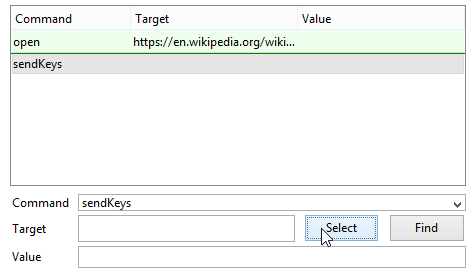
- Klick on the search box of Wikipedia.
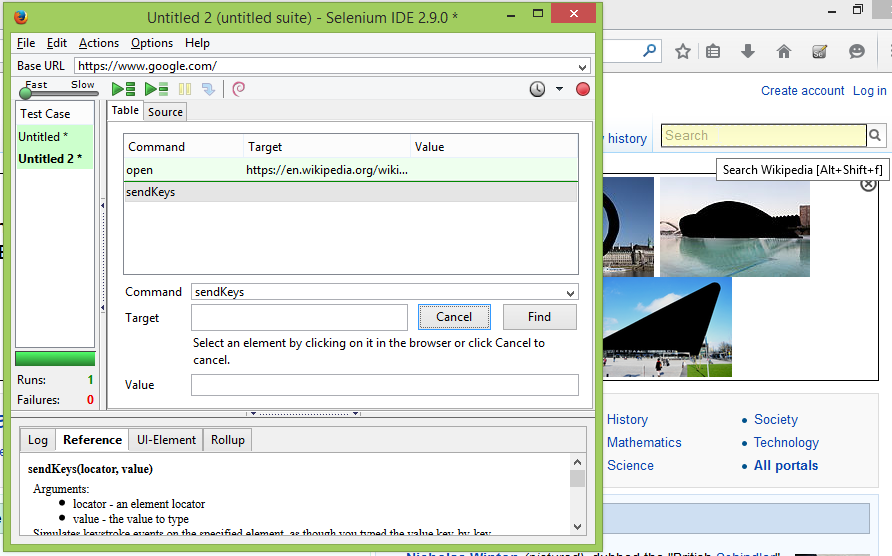
- In the current Target-Field should appear “id=searchInput”. This is the locator which identifies the element on which we want to use the current command.
- Type in the Value-Field: “Banana”
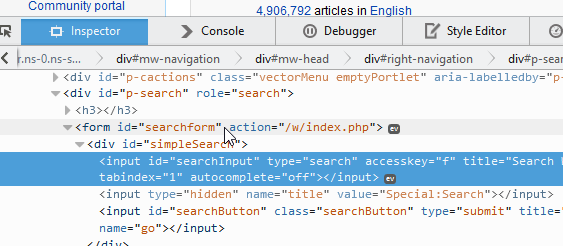
- To execute the search, we need to submit the form of the search input field. The easiest way to locate an element on a web page is a unique id. To find out whether the wrapping form of the search input field has a unique id, right click on the search field and choose “Inspect Element” in the context menu.
- The developer tools open and we can inspect the html code. Here we see that the wrapping html-form has a uniqe id: “searchform”.
- With this information add the next command: submitAndWait with the target: “id=searchform”. We are choosing submitAndWait as an alternative to add “pause” again, sothat the Selenium IDE will wait for the page to load before continuing with the next test step.
- Add one more command: assertText, use the “Select”-Button next to the target field again to fill in the target by clicking on the headline “Banana” of the Wikipedia page. Type in the Value-Field “Banana”.
- Run the test case. The result should look like this:

Save test cases & test suits
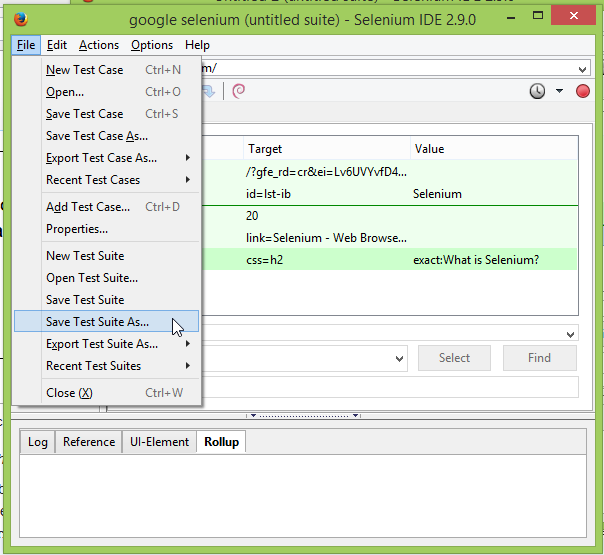
- Go to File > Save Test Case As… to save the current test case.

- Double-click on your second test case and save as well.
- Go to File > Save Test Suite As… to save the whole suite (the collection of your test cases).
- Now you can close the Selenium IDE and Firefox without loosing your work. Everything is safe.
Load & run test suits
- Open Firefox again and open the Selenium IDE by clicking the icon in the toolbar.
- Go to File > Open Test Suite…
- Browse to the location where you saved your test suite, select it and press “open”.
- To run the whole suite (all test cases in the suite) click on the first green arrow:
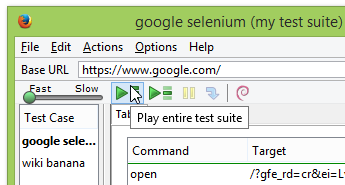
- Now the Selenium IDE will execute one after another all test cases that are in your current test suite. The result should look like this (only the names might differ depending on the names you chose for your test cases when saving them):
More About Target Locators
For most commands you need to use a locator in the Target Field of the Selenium IDE to tell the tool on which element of the web page the command should be used. There are four different ways to locate elements (which are the same for the Selenium IDE and FRET) that are explained here.
More Commands
In this tutorial you already used the some important commands:
- open
- type
- pause
- clickAndWait
- assertText
- sendKeys
- submitAndWait
There are various more commands to simulate all kinds of different user interactions with a website. We are working on a command reference and until then please refer to seleniumhq.org and the Selenium Documentation.
Comments are closed.
Welcome to a fascinating journey into the Selenium IDE world, aspirant testers and tech enthusiasts.
This tutorial is your key to mastering Selenium IDE’s amazing features, whether you’re a novice eager to delve into the world of automated testing or a seasoned professional looking to improve your skills.
Prepare for an exciting journey as we uncover this tool’s secrets and give you the knowledge and abilities to write reliable, effective test automation scripts. So prepare for an insightful Selenium IDE tutorial that will elevate your testing game by grabbing your virtual testing lab coat and donning your coding glasses.
Latest News About Selenium IDE
Selenium IDE encountered a fork in its journey when Firefox’s unfortunate withdrawal of support presented itself.
A brand-new Selenium IDE that is independent of any particular browser was developed as a result of the quick response of the committed Selenium community to the challenge.
This updated Selenium IDE, developed as a web extension, offers a plethora of improvements and features that address the changing requirements of automated testing.
The new Selenium IDE, which embraces a cross-browser approach, supports popular browsers like Chrome and Firefox, giving testers the ability to seamlessly run their automated tests across various platforms.
The new Selenium IDE features a new and dynamic interface with enhanced recording capabilities, advanced debugging tools, and comprehensive test reports that continue to streamline the test automation process for both novices and experts.
+This tenacious transformation proves the Selenium community’s unwavering dedication to offering an exceptional testing experience and guarantees that Selenium IDE continues to flourish even in the face of shifting technological environments.
Features of the New IDE
Cross-Browser Compatibility: By supporting popular web browsers like Chrome and Firefox, the new Selenium IDE enables testers to create and run tests on various platforms.
Improved Recording and Playback: Testers can easily record and automate their interactions with web applications thanks to improved recording capabilities. The playback feature makes sure that tests go off without a hitch and consistently.
Intelligent Element Locators: The IDE offers intelligent locators that adjust to changes in the application’s structure, simplifying test maintenance and lowering the demand for ongoing updates.
Strong Debugging Tools: With features like breakpoints, step-by-step execution, and variable inspection, debugging is made simple. The root causes of failures can be found and efficiently resolved by testers.
Test Data Management: The IDE provides a range of adaptable options for handling test data, such as data-driven testing, which enables testers to run the same test against various datasets.
Customizable: Selenium IDE can be customized and extended using plugins and custom scripts, allowing testers to improve its functionality in accordance with their unique needs.
Test reporting and metrics: The IDE generates thorough reports that include specific information about test results, such as pass/fail status, execution time, and screenshots. These reports help identify areas that need more attention and offer insightful information about test coverage.
Collaboration and Knowledge Sharing: Test scripts are easily shared and worked on by teams, encouraging productive teamwork and knowledge exchange.
Integration with Selenium Grid: Thanks to the new Selenium IDE’s seamless integration with Selenium Grid, testers can distribute tests across multiple machines and run them concurrently, greatly cutting down on the time it takes to complete a test.
Support for Continuous Integration (CI): The IDE easily integrates with well-known CI/CD tools, giving testers the ability to incorporate automated tests into their development workflows and achieve continuous testing.
About Selenium IDE
Selenium integrated development environment that is plugged into Firefox. It is an automation testing tool that is very simple, easy and user-friendly. It offers easy installation, learning, and creation of test scripts. Selenium IDE is based on record and playback principle. It is good for all kinds of testing.
Features of Selenium IDE That Makes it the Best!

Selenium is a widely used automation testing tool and offers extensive features. Some of the common features of Selenium IDE are:
- It offers an easy and simple record and playback features
- Supports Intelligent field selection
- Auto-completion of Selenium commands
- Walkthrough tests
- Easy Debugging capabilities
- Easy setting of breakpoints
- Save tests as HTML, Ruby, Python, C# scripts, or any other format
- Supports Selenium user-extensions.js
- Supports automatic assertion of title for all pages
- Supports easy customization
- Does not require programming skills
The Drawback of Selenium IDE
Selenium IDE is a Firefox plug-in hence it supports only Firefox and the test scripts Created in Selenium IDE can only be executed in the Firefox browser.
Step-by-Step Tutorial about learning Selenium IDE
Downloading and Installing Selenium IDE
Now when we have a good idea on what is Selenium IDE, let us move to the next step of Downloading and Installing Selenium IDE.
To download Selenium IDE you need to have Mozilla Firefox, if you have it well and good if you don’t have it, download it.
Steps to download and install Selenium IDE
1) Launch Mozilla Firefox Browser.
2) Open Selenium IDE Add-ons page by typing URL: https://addons.mozilla.org/en-us/firefox/addon/selenium-ide/ in your browser. Next Click on Add to Firefox button.

3) You will get a popup asking for your permission to install Selenium IDE Add-ons or not. Click the Install button over the popup.

4) Firefox will then install Selenium IDE software and you will get a popup asking you to restart the Firefox. Click the restart button. The Selenium installation will now be reflected on your browser.
5) After you restart you ur browser you can find the selenium IDE under the tools menu list present at the top bar

6) Click on selenium ide your selenium ide will launch
Sections of Selenium IDE
Selenium IDE is divided into different sections. Before start working on it, you must know about these categories:
Menu Bar
present at the uppermost of the Selenium IDE window. The menu bar consists of five sub-modules.
File Menu
File Menu Create, Save and Export Test Case and Test Suite of Selenium IDE. You can open the file menu by pressing Alt + F, or by clicking on the File menu.
Under File menu you can find:
- New Test Case: It creates a new blank Test Case
- Open: It Open already saved Test Cases.
- Save Test Case: Saves the opened Test case.
- Save Test Case As: Saves opened Test Case in a specific location and has a specific name.
- Export Test Case As: Assists exporting test cases in various languages like Ruby/Python/Java/C# in both Selenium Remote Control and Selenium WebDriver Format.
- Recent Test Cases: Returns a list of few last saved Test Cases.
- Add Test Case: Search test cases and merge them into the currently opened test case.
- Properties: returns the properties opened test case.
- New Test Suite: creates a blank Test Suite
- Open Test Suite: Opens existing Test Suite.
- Save Test Suite: Saves opened Test Suite.
- Save Test Suite As: Saves opened Test Suite in a specific location and has a specific name.
- Export Test Suite As: Assists exporting test Suite in various languages like Ruby/Python/Java/C# in both Selenium Remote Control and Selenium WebDriver Format.
- Recent Test Suites: Returns a list of few last saved Test Suite.
Default Interface of Selenium IDE

Edit Menu
Edit Menu helps to Cut Copy Paste and Insert Command in Selenium IDE Test. You can open the Edit menu by pressing Alt + E, or by clicking on the Edit menu.
Under the Edit menu you can find:
- Undo: last action or few last performed actions are undone
- Redo: Re-do the last undone action or series of last undone actions.
- Cut: Copies and removes the selected command or test step from the current location to some other location in the test.
- Copy: Copies selected command or test step from current location to some other location in the test. But it does not remove the command from the previous locations.
- Paste: Pastes cut/copied command to a selected location in the test.
- Delete: Deletes the chosen command.
- Select All: Select all the commands in Test Step Pane.
- Insert New Command: Insert a row at a selected location to write new commands
- Insert New Comment: Insert a row at a selected location to write a new comment
Read also: Selenium 4: New Features and Updates
Actions Menu
Helps us to learn Options to Record Play Run And Debug Selenium IDE Test.
- Record: It Records the user actions on the webpage via the Firefox Web Browser. While recording, the menu item keeps displaying a chack against items.
- Play Entire test suite: it play-back/re-run every Test Case in the Test Case Pane, following top to bottom approach.
- Play the current test case: play-back the selected Test Case.
- Playtest Suites periodically: let the specified test suite to execute at specific times. It is the best way when test suits are required to be rerun periodically as it does not require any human intervention, once specified it will rerun test cases automatically
- Toggle Breakpoint: allows you to specify one or more breakpoint(s) to forcefully break the execution at specified steps.
- Set / Clear Start Point: it permits the testers to select a start point to start executing the test. It is important for subsequent runs.
- Pause / Resume: this enables the pausing and resuming of the test at any point between the test execution.
- Step: it permits to step through the playing-back of the test case. It is important for debugging purposes.
- Execute this command: This allows testers to execute a particular command instead of executing the complete test case. It is important when testers want to see the behavior of any specific command
- Fastest/Faster/Slower/Slowest: it allows you to set the execution speed from fastest to lowest concerning the responsiveness of the application under test.
Other categories available at Menu Bar are:
Options Menu and Help Menu
Tool Bar
The ToolBar includes the Buttons that Control the execution of test cases, for debugging the test cases, setting up the speed of the test, Stopping, Playing and Recording of test cases.
Test Case Pane
All the test cases recorded by IDE are available in Test Case Pane. It can open more than one test case at the same time and supports easy shuffling between the test cases.
It also offers Test Execution Result Summary including entire Test Suite status, Total number of Test Executed, etc.
Test Case Pane

It is the place where Test Case Steps are recorded. All the user actions are recorded in the order they are performed. It also allows the editing and changing of the test cases
Output Pane
The bottom pane or the Log Pane offers the following functions
- Log,
- Reference,
- UI-Element, and
- Rollup
The function performed depends upon which tab is selected.
Record the Selenium IDE Test Case.
- Launch Firefox Selenium IDE. Type the URL. Click the Record button, a red button on the top right corner. It will record Test Cases.
- In Firefox, type the same URL as in step 1. Firefox will take you to the related webpage.
- Right-click anywhere on this page, you will get Selenium IDE context menu. In the context menu go to Show Available Commands> Web Page Name.
- Click on MyAccount
- Enter UserName and Password and then click on the login button.
- To stop the recording click the record button again. Click on the Table tab and you will be able to see the recorded commands.
- Click on the Source tab to see HTML Code.
Read also: 11 Awesome Selenium Alternatives For Testers in 2019
Save the Selenium IDE Test Case.
- To save a test case go to File Menu and click on Save Test Case As.
File -> Save Test Case As.
- Choose the desired location and give your file a name and click on Save.
- You can see the name of the saved test case on the left-hand side.
- The file will be saved as HTML.
Playback Selenium IDE Test Script
Open a new tab Firefox. Click the Play button in Selenium IDE. It will execute the previously recorded tests.
Selenium Commands

Selenium commands or Selenese are a set of test cases that are deployed to test web applications using Selenium.
Selenium commands are of three types:
Actions
Actions commands control the state of the application. Operations under action commands are:
- type this box,
- click this link
- select option.
Some of these commands can be suffixed with AndWait like click and wait, type and wait. This prompts Selenium to wait until the web page is loaded. If these commands fail, the existing test is stopped.
Accessors
These commands automatically create Assertions and inspect the state of the application.
Assertions
They inspect the state of the application adapts to what is anticipated.
They can be further divided into three categories:
- Assert:
- Verify:
- WaitFor:
Some of the Commonly used commands in Selenium IDE:
- type: Set the value of the input field
- open: Opens a web page through the given URL.
- click clicks on a checkbox, link, button or radio button.
- clickAndWait: When you click on the checkbox, link, button or radio button, and a new page is loaded it calls waitForPageToLoad.
- select: It selects an option drop-down.
- selectFrame: It is used to select a frame from the present window.
- verify title/assert title: Authenticates an anticipated page title.
- verifyElementPresent: Confirms if the
- indicated element is present on the page.
- highlight: Altersthe backgroundColor of the indicated element.
- pause: Wait for the indicated time period
- echo: Prints indicated message in your Selenium command tables.
What are Locators?
Locators in Selenium IDE are used to find and match the elements in the web page that are required to communicate with. The use of the right locator promises faster, more trustworthy and low maintenance tests. But choosing the right locators can sometimes become a challenging task.
Locators in selenium IDE

Locators tell on which GUI elements do Selenium IDE needs to operate on. The correct identification of the locators is very important and it is equally challenging.
There are many commands in Selenium IDE that do not require Locators, but most of the commands do require locators. The locators to be used depends on the AUT.
The various types of locator are:
Locator: ID
It is a common way to locate different elements as every element has a unique ID.
Target Format: id=id of the element
Consider any test app, let it be Facebook.
- Check the “Email” text box using Firebug and note down Locator: ID
- Launch Selenium IDE and write “id=(Locator ID you retrieved in the first step)” in the Target box. When you click on the Find button next to the target box, the “Email ID” text box will be emphasized with a yellow and green border. This means that Selenium IDE has located the “Email ID” text box correctly.
Locator: Name
Locator name is quite similar to Locator: ID. The only difference is that here we use name instead of ID.
Target Format: name=name of the element.
Consider any test app, let it be Facebook.
- Check the “Email” text box using Firebug and note down Locator: Name
- Launch Selenium IDE and write “Name=(Locator name you retrieved in the first step)” in the Target box. When you click on the Find button next to the target box, the “Email ID” text box will be emphasized with a yellow and green border. This means that Selenium IDE has located the “Email ID” text box correctly.

Locator: Link
This locator is used for hyperlink texts. It can be used by beginning the target with “link=” tailed by hyperlink text.
Target Format: link=link_text
Consider any web app as a text app.
- Check any element that has a hyperlink text and using Firebug and notes down Link Text
- Launch Selenium IDE and write “Link =(Link Text you retrieved in the first step)” in the Target box. When you click on the Find button next to the target box, the corresponding text box will be emphasized with a yellow and green border. This means that Selenium IDE has located the element correctly.
Locator: CSS
CSS Selectors are though a complex method to locate elements on a web page, but they are the most preferred method of locating elements in advanced Selenium as they can even detect elements that have no name or no ID.
CSS Selectors are also strung patterns That has the ability to recognize an element based on its arrangement of HTML tag, id, class, and attributes. CSS Selectors have many formats, but the most common are:
- Tag and ID
- Tag and class
- Tag and attribute
- Tag, class, and attribute
- Inner text
Locator: Xpath
XPath is a language for navigating the DOM (document object model) of a web page. It can locate any element on the web page and is hence the most potent and supple locator.
Some of the Firefox Add-ons that can help in finding XPath of an element:
- Firebug
- XPath Checker
- File path
- XPath Finder
Locator: DOM
The Document Object Model is an HTML document that can be accessed using JavaScript. It uses hierarchical dotted notation to locate an element on the page.

Conclusion
If you wish to learn more about selenium we have comprised a tutorial just for you which will take you deep into the tool.
Get an eBook: Download PDF
Frequently Asked Question(s)
How to learn Selenium IDE?
If you are looking for selenium tutorial for beginners, There are many resources available to help you acquire the skills and knowledge you need when learning Selenium IDE. While our blog is a great place to start for learning insights and advice, it is important to research various sources to gain a more comprehensive understanding. Our blog serves as a stepping stone for beginners by offering useful information, tutorials, and insights into Selenium IDE. It is advised to supplement your learning process, though, with additional resources like the official Selenium documentation, online guides, video classes, and interactive coding environments. Combining these resources will help you gain more knowledge and hands-on experience, which will help you master Selenium IDE and effectively use its automation features. So dive into our blog and then continue on to explore the vast library of learning resources to maximize your Selenium IDE experience.
What is the difference between Selenium and Selenium IDE?
Selenium is a broad collection of web application testing tools, and Selenium IDE (Integrated Development Environment) is one particular Selenium tool in the collection. With tools like Selenium WebDriver and Selenium Grid, Selenium offers a robust framework for automating web browsers. With the help of Selenium WebDriver, users can interact with web components, create test scripts in a variety of programming languages, and run intricate testing scenarios. On the other hand, Selenium IDE is a less complex tool that is primarily used by beginners and for quick prototyping. It offers a record-and-playback feature that enables users to capture their interactions with a web application and automatically produce test scripts. Selenium IDE is user-friendly for beginners and appropriate for test cases with less complexity, whereas Selenium WebDriver offers more flexibility and customization options.
Can I learn Selenium in 2 days?
Due to the depth and breadth of knowledge needed to effectively use this potent automation tool, learning Selenium in just two days is a difficult task. While learning the fundamentals of Selenium might be possible in a short amount of time, mastery and expertise typically require dedicated time and effort. Understanding programming languages, HTML, CSS, and JavaScript is a prerequisite for mastering Selenium, as is knowledge of test automation frameworks, locators, and best practices. To develop the knowledge and skills required for effective Selenium automation, it is advised to devote more time to in-depth learning materials, hands-on training, and practical application.
What is XPath and maven in Selenium?
XPath is a powerful language used to find elements within the structure of an XML or HTML document. For automation testing with Selenium, web elements on a webpage are frequently identified using XPath. In order to navigate the HTML structure and identify specific elements based on attributes, hierarchy, or other features, testers can define specific paths or patterns. Selenium WebDriver can use XPath expressions to precisely locate elements, even in complex web pages where other locators might not be adequate. With its flexibility and accuracy in element location, XPath is a useful tool for Selenium automation.
Maven: Projects that use Java often use Maven as a build automation and project management tool. Maven makes managing dependencies and project structure simpler in the context of Selenium automation. By defining project configurations, managing libraries and dependencies, and automating the build process, it facilitates the organization and construction of Selenium projects. Maven uses «pom.xml» files, which are XML-based configuration files, to define project specifics, dependencies, and build instructions. In order to make sure that the Selenium project has all required libraries and frameworks, testers can easily manage and resolve dependencies using Maven. Maven is an important tool in Selenium automation workflows because it facilitates effective project management, version control, and integration with continuous integration systems.
How to write script in Selenium IDE?
These steps should be followed to write a script in Selenium IDE:
Launch Selenium IDE: Depending on your preferred version, launch the Selenium IDE application or add it as a browser extension.
Start Recording: To begin recording, click the «Record» button. As you interact with the web application, Selenium IDE will start recording your actions.
Interact with the Web Application: Use the web application you are testing to carry out the desired actions, such as clicking buttons, typing in text, or navigating between pages. Each step will be recorded by Selenium IDE.
Add Assertions and Verifications: You can add assertions and verifications to help the application’s expected behavior be verified. While verifications confirm that elements have the expected values, assertions determine whether a given element or condition is present.
The Selenium IDE offers a number of wait commands to add delays between steps. This makes sure that the script waits for certain conditions to be satisfied or for elements to load before continuing.
Edit the recorded script if necessary to suit your needs. Using the available Selenium IDE commands and syntax, you can alter commands, insert comments, or add new commands.
Play and Test the Script: Press the «Play» button to run the script. Check for errors or odd behavior as you watch the execution in the browser. Step through the script using the debug features to find problems.
Once you are happy with the script, save it for later use by exporting it. Depending on the programming language you prefer to use, you can export the script in different formats such as HTML, Java, C#, or Python to further customize it or integrate it with automation frameworks.
In this selenium IDE tutorial, I want to go over what I covered in my previous article on Selenium IDE and in my interview with Dave Haefner, one of the folks working on the new Selenium IDE at Applitools.
(I originally posted this guide on how to use Selenium IDE in 2018, BUT it’s still valid)
Key takeaways:
- Selenium IDE can be installed in Chrome and Firefox.
- You can modify your Selenium IDE test script, run it, and play it back.
- There are two new features in the Selenium IDE that will blow your mind.
Get Automation Testing Tips
How to Install Selenium IDE
First, you need to install Selenium IDE (Integrated Development Environment).
Selenium IDE is a browser extension. Currently, both Chrome and Firefox are supported.
So if you used Selenium IDE in the past, the new version of this record and playback tool for test cases supports not only Firefox but also Chrome.
To Install Selenium IDE in Chrome
To install in Chrome, just click on ‘Add to Chrome‘ and then click on Add Extension.
Once IDE is installed, you’ll see an icon in your browser toolbar.
Click on that icon, and it will bring up Selenium IDE.

Create Your First Selenium IDE Automation Test
Next, let’s create our very first test and project in Selenium IDE.
When you start up, you have an option to either create a new project or open an existing project.
Let’s create a new one. Call it JoeDemo.
The base URL is the URL your going to use for your test. For this example, enter: https://testguild.com/SeleniumTestPage.html.
This will bring up the application under tests.
You’ll know that it’s recording because you’ll see a “Selenium IDE is Recording” message in the bottom right.
So as you interact with your application behind the scenes, Selenium IDE is recording your actions.
Also, with the new Selenium IDE, you can right-click on your application, and you’ll have a new menu item called Selenium IDE.

This is where you can go to your verifications and assertions, and also, you can store values as variables and use them later, which will check in a moment.
Next, give the test a name JoeTest1
The Selenium IDE Interface Tour
Let’s take a look at what the new Selenium IDE looks like and what it just did as we were recording our tests.
The first thing I normally do when I start using a new tool is I just get familiar with all the menu options in the tools IDE.
Now let’s just look at the different areas within Selenium IDE, and then we’ll take a deeper look into what Selenium IDE actually recorded and how we can modify our test script and run it and play it back.
So there are different areas within the IDE that I like to break things down into.
Selenium Run Command
The first section is the Run area.
The first run option is the Run All test. So if you have multiple tests, you can run your whole test suite in Selenium IDE by using this option.

You also have the Run Current Tests. So, of course, this is self-explanatory, but Run Current tests would be used to run the current test.

The other control I also include within the Run commands is the Test Execution Speed. This controls how fast you want the test to run. A lot of times, a good practice is to not always do it as fast as possible. Many times when you run your test, there’s sometimes network latency and little hiccups in the network that cause time variations. So to handle that, sometimes you wanna run your test not as fast as it can be, but maybe just a little bit slower than normal.
Selenium IDE Debug Controls
So the next set of controls I like to call the Debugging Controls.

The first one is the Step option. This allows you to step over your test case by running each command one at a time. It’s really helpful when you’re debugging to go step by step and look exactly at what’s happening at each point within your test. It’s really excellent for hard-to-find issues that you may not know just by running the test cases and looking at the results.

Another debug option is the BreakPoint feature. Breakpoints are really cool because they allow you to stop at a particular line of code in your test scripts. This is really handy to have if you have a very long script that is failing, say, near the end of the test run.
Basically, you can do as you can pause the running to see what state your application is in before you get to that point, and then you can then use this in conjunction with your step control to step from that point on to really pinpoint what’s happening in your test at a given point in time.

You also have a Pause on Exception option. Using this will cause the debugger to pause before a red message appears in the console or log. So you get to inspect what’s happening before things go wrong.
Selenium Test Control Panel

The next section is the Test Control Panel area. This contains a command, a target, a value, and a description.
- The command is the action to perform against an element within your application.
- The target is the value to use to identify your element.
- The value is then the value to insert into your element. Not all elements need a value, but if they do this way, you would enter into.
- The description allows you to really name your step in the human-readable format, and a description that makes it really easy for anyone to understand when they’re looking at your particular script.
IDE Console Options

The last major options are the selenium Console options. This contains a Log and a Reference tab.
- A Log is a step by step the results of your test.
- For the Reference tab, if you click on any step within your test and go to reference, it’ll explain what that command is doing. So it’s really helpful to get the information about the command that’s currently highlighted with the new test to get a little more information on what exactly it is and what the arguments are that it expects.
So now that we understand the different sections within Selenium IDE, let’s run our test and see the results.
Run and Modify Your First IDE Selenium Test
If you look at the log file that we mentioned earlier, it will show you step by step what’s happening along the way and what the result was.

Another option within Selenium IDE is you can modify your test. So to modify a test, if you right-click, you get another Selenium IDE drop-down, and that gives you different options you can perform. So you can delete lines, you can insert lines, you can add a breakpoint, and you can execute a command.
So let’s add a new line of code and see how we can modify our test.
Highlight the line where you want to enter in your new line. Right click and click on insert new commands.
The new command to enter is actually a new feature within Selenium IDE that’s really cool. And that’s the ability to add conditional logic within your test script. So things like IF Else statements, Do statements, timers, and loops are things that you’re probably very familiar with if you’re used to programming.
Work With Me
How to Create a Variable in Selenium IDE
The first thing I want to do is I want to store the text that’s returned to me when we select its operating system in our example.
In the Command field, select Store Value.

In the Target, which is the locator used to identify the particular element, enter name=about.
Next, create a variable called myOS.
Enter a new line and enter the Echo command. Echo is pretty much like a print statement. So to print the value of myOS that was captured, enter ${myOS}.

So how this works is that it will go to the operating system field. It’s going to grab the text that appears. It’s going to store it in a variable called myOS, and then it’s going to print that out to the log file.
Run the tests, look at the Log, and you will see the value of the operating system you are running on. In my example, the value is Macintosh.
How to Add Control Logic in Selenium IDE
Now let’s add one of those new selenium ide flow control logic features that we talked about earlier. So we’re just going to add a simple IF statement. Just to get a handle for not only capturing a variable but then making decisions on it later on, which is a very common activity you’ll need to do as you create more and more complicated automated tests.
Add another line.
Under Command, add IF. If you don’t know what the IF commander is, just go to reference, and it will tell you exactly what the IF command is for.
For the target enter: ${myOS} ===”Macintosh”.

Add another line and in the Command, enter Echo, and in Target, add Steve Jobs.
Add another line to close out the IF statement. To close an IF statement, enter the Command value End statement. If you can see it within the reference, a statement basically terminates that control flow.
Run the test and see what happens.
As you can see, it created a variable. It held onto the value of Macintosh. Since the value did equal Macintosh, it did print out Steve Jobs.
So you can create more complicated conditional statements, so we could have added on an Else If statement to say if it equals windows, then print Bill Gates. So if someone took this script and ran it on a Windows machine, it would have printed out Bill Gates.
How To Install and Run IDE Test Using Selenium IDE Runner
The last feature I want to show you is awesome for running tests in a continuous integration continuous delivery system. So let’s install it.
Go to: https://github.com/SeleniumHQ/selenium-ide/tree/master/packages/selenium-side-runner
Run the install NPM command: npm install -g selenium-side-runner (I assume you already have Node.js installed on your system since you will need it for this to work).
Open up a terminal/command line window and run the demo script: For this example, the command would be selenium-side-runner JoeDemo.side.
Notice how the test passed.

As I mentioned, it is really useful when you’re running in CI/CD. If you just want to create a quick and dirty test and just run, it says Jenkins. Because you can run it from a command line, it’s very easy to use in that type of environment.
Two New Features that Will Blow Your Selenium Mind.
Here are two of the biggest features in the new Selenium IDE that are going to change your record and playback test automation efforts in a big way. I don’t think I’m not overstating it. When you see these two changes, I think your mind is going to be blown.
Automatic Fallback Locators
The first one is the automatic Locator element selector functionality that’s been added to the new Selenium IDE.
When you record with IDE, not only does a record what it thinks is the main identifier for your element. It also automatically records all the other ways it can use to identify that element.

And the reason why that’s huge is a lot of times, you may have a developer that changes the name or the ID but doesn’t go back into the actual automation code and change it. So when your test runs or fails. It’s a maintenance nightmare to have to go in and make that change.
Even if you’re using page objects, you still need to go in and make the change.
What’s really cool about the new Selenium IDE is that if it doesn’t find the preferred locator, it will go through all the other locators automatically to find that element.
So that’s going to save you a lot of time with maintenance and make your Selenium tests a lot more reliable. So that’s a huge, huge feature that’s going to be a game–changer.
Automatic Waits
So the second change is what I call the number one killer of selenium script performance reliability, and that is synchronization.
Many times people will create a test and not add any type of synchronization to say, before I interact with this element, is it available, is it visible? They just automatically made assumptions and just went on to try to perform a step on that element.
So a lot of times, the test will just fail randomly because that element sometimes appears within a certain time, and sometimes it doesn’t. You have to then try to find what’s the best synchronization method to use to make your test more reliable.
So there are explicit waits and implicit waits and all these different ways that you can actually use to synchronize your test to make sure before and interact with an element that it’s available to be interacted with.
With the new Selenium IDE, you don’t have to worry about that any longer!
It now will automatically add those waits for you without you having to do anything. So you record your script, and when you play it back, it automatically knows what to wait for. So it automatically adds those synchronization points for you automatically behind the scenes.
So two killer features, and honestly, the two biggest ones that tend to cause your test to be unreliable and hard to maintain, have been addressed in this new Selenium IDE.
Check it out. Tell me what you think. Let me know how it works for you.

Contact Me
Что такое Selenium IDE?
Selenium IDE (интегрированная среда разработки) — самый простой инструмент в Selenium Suite. Это дополнение к Firefox, которое очень быстро создает тесты благодаря своей функции записи и воспроизведения. Эта функция похожа на QTP. Это легко установить и легко учиться.
Из-за своей простоты Selenium IDE следует использовать только как инструмент для создания прототипов, а не как общее решение для разработки и сопровождения сложных тестовых пакетов.
Хотя вы сможете использовать Selenium IDE без предварительных знаний в программировании, вы должны, по крайней мере, быть знакомы с HTML, JavaScript и DOM (Document Object Model), чтобы использовать этот инструмент в полной мере. Знание JavaScript понадобится, когда мы перейдем к разделу о Selenese команда « runScript».
Selenium IDE поддерживает режим автозаполнения при создании тестов. Эта функция служит двум целям:
- Это помогает тестеру быстрее вводить команды.
- Это ограничивает пользователя от ввода недопустимых команд.
Особенности Selenium IDE

Строка меню
It is located at the top most portion of the IDE. The most commonly used menus are the File, Edit, and Options menus.
File menu
- It contains options to create, open, save and close tests.
- Tests are saved in HTML format.
- The most useful option is «Export» because it allows you to turn your Selenium IDE test cases into file formats that can run on Selenium Remote Control and WebDriver
- «Export Test Case As…» will export only the currently opened test case.
- «Export Test Suite As…» will export all the test cases in the currently opened test suite.

- As of Selenium IDE v1.9.1, test cases can be exported only to the following formats:
- .cs (исходный код C #)
- .java (исходный код Java)
- .py (исходный код Python)
- .rb (исходный код Ruby)

Редактировать меню
- Он содержит обычные параметры, такие как Отменить, Повторить, Вырезать, Копировать, Вставить, Удалить и Выбрать все.
- Двумя наиболее важными параметрами являются « Вставить новую команду » и « Вставить новый комментарий ».

- Вновь вставленная команда или комментарий будут помещены поверх текущей выбранной строки .

- Команды окрашены в черный цвет .
- Комментарии окрашены в фиолетовый цвет.

Меню настроек
Он предоставляет интерфейс для настройки различных параметров Selenium IDE.
Мы должны сосредоточиться на параметры и формат буфера обмена вариантов.
|
|
Формат буфера обмена
|

Например, когда вы выбираете Java / JUnit 4 / WebDriver в качестве формата буфера обмена, каждая команда Selenese, которую вы копируете из редактора Selenium IDE, будет вставлена как код Java . Смотрите иллюстрацию ниже.

Диалоговое окно «Параметры Selenium IDE»
Вы можете запустить диалоговое окно Параметры Selenium IDE, щелкнув Параметры> Параметры … в строке меню. Хотя доступно множество настроек, мы сконцентрируемся на нескольких важных.

- Значение времени ожидания по умолчанию . Это относится ко времени, когда Selenium приходится ждать появления или доступности определенного элемента, прежде чем он выдаст ошибку. Значение времени ожидания по умолчанию составляет 30000 мс .
- Расширения Selenium IDE . Здесь вы указываете расширения, которые хотите использовать для расширения возможностей Selenium IDE. Вы можете посетить http://addons.mozilla.org/en-US/firefox/ и использовать «Selenium» в качестве ключевого слова для поиска определенных расширений.
- Запомните базовый URL. Установите этот флажок, если вы хотите, чтобы Selenium IDE запоминала базовый URL при каждом запуске. Если вы снимите этот флажок, Selenium IDE всегда будет запускаться с пустым значением для базового URL.
- Автозапуск записи. Если вы отметите это, Selenium IDE сразу запишет действия вашего браузера при запуске.
- Локатор строителей. Здесь вы указываете порядок создания локаторов во время записи. Локаторы — это способы сообщить Selenium IDE, какой элемент пользовательского интерфейса должен выполнять команда Selenese . В приведенной ниже настройке, когда вы щелкаете элемент с атрибутом ID, идентификатор этого элемента будет использоваться в качестве локатора, поскольку «id» является первым в списке. Если этот элемент не имеет атрибута ID, Selenium будет искать атрибут «name», поскольку он является вторым в списке. Список можно продолжать до тех пор, пока не будет найден соответствующий.

Панель базовых URL

- Он имеет выпадающее меню, которое запоминает все предыдущие значения для быстрого доступа.
- Команда Selenese «open» приведет вас к URL, который вы указали в Базовом URL .
- В этой серии руководств мы будем использовать http://newtours.demoaut.com в качестве нашего базового URL. Это сайт для Mercury Tours, веб-приложения, поддерживаемого HP для целей веб- тестирования . Мы будем использовать это приложение, потому что оно содержит полный набор элементов, которые нам нужны для последующих тем.
- Базовый URL очень полезен для доступа к относительным URL . Предположим, что ваш базовый URL-адрес установлен на http://newtours.demoaut.com . Когда вы выполните команду «open» с целевым значением «signup», «Selenium IDE» направит браузер на страницу регистрации. Смотрите иллюстрацию ниже.

Панель инструментов
 |
Скорость воспроизведения . Это контролирует скорость выполнения тестового сценария. |
 |
Запись. Это начинает / заканчивает сеанс записи. Каждое действие браузера вводится как команда Selenese в редакторе. |
 |
Слушать весь набор тестов . Это будет последовательно воспроизводить все тестовые случаи , перечисленные в Test Case панели. |
 |
Воспроизвести текущий контрольный пример . Будет воспроизведен только выбранный в настоящий момент тестовый набор на панели тестовых наборов. |
 |
Пауза / Резюме . Это приостановит или возобновит воспроизведение. |
 |
Шаг . Эта кнопка позволит вам перейти к каждой команде в вашем тестовом скрипте. |
 |
Применить правила свертки . Это расширенный функционал. Это позволяет группировать команды Selenese вместе и выполнять их как одно действие. |
Панель тестовых случаев
|
|
|

редактор
Вы можете думать о редакторе как о месте, где происходит все действие . Он доступен в двух видах: Таблица и Источник.
Табличное представление
- Большую часть времени вы будете работать в Selenium IDE, используя Table View .
- Здесь вы можете создавать и изменять команды Selenese.
- После воспроизведения каждый шаг имеет цветовую кодировку.

- Чтобы создать шаги, введите имя команды в текстовом поле «Команда».
- Он отображает раскрывающийся список команд, которые соответствуют введенной вами записи.
- Target — это любой параметр (например, имя пользователя, пароль) для команды, а Value — входное значение (например, tom, 123pass) для этих целей.

Исходный вид
- Отображает шаги в формате HTML (по умолчанию).
- Это также позволяет вам редактировать ваш скрипт так же, как в табличном представлении.

Панель журнала
Панель журнала отображает сообщения во время выполнения. Он предоставляет в режиме реального времени обновления о том, что делает Selenium IDE.
Журналы делятся на четыре типа:
- Отладка — по умолчанию сообщения отладки не отображаются на панели журнала. Они появляются только тогда, когда вы их фильтруете. Они предоставляют техническую информацию о том, что Selenium IDE делает за кулисами. Он может отображать сообщения, такие как загрузка определенного модуля, вызов определенной функции или загрузка внешнего файла JavaScript в качестве расширения.
- Информация — сообщает, какую команду Selenium IDE выполняет в данный момент.
- Предупредить — это предупреждающие сообщения, которые встречаются в особых ситуациях.
- Ошибка — это сообщения об ошибках, генерируемые, когда Selenium IDE не может выполнить команду или если условие, указанное в команде «verify» или «assert», не выполняется.

Журналы могут быть отфильтрованы по типу . Например, если вы выберете вариант «Ошибка» из выпадающего списка, на панели журнала будут отображаться только сообщения об ошибках.

Панель ссылок
Справочная панель показывает краткое описание выбранной в настоящее время команды Selenese в редакторе . Он также показывает описание локатора и значение, которое будет использоваться в этой команде.

Панель элементов интерфейса
UI-элемент предназначен для опытных пользователей Selenium. Он использует JavaScript Object Notation (JSON) для определения отображений элементов. Документация и ресурсы находятся в разделе «Документация элемента пользовательского интерфейса» в меню «Справка» Selenium IDE.

Пример экрана UI-элемента показан ниже.

Свернуть панель
Свертывание позволяет выполнить группу команд за один шаг. Группа команд называется просто «свертка». В нем интенсивно используются концепции JavaScript и UI-Element для формулирования набора команд, аналогичного «функции» в языках программирования.
Раскаты многоразовые ; Это означает, что они могут использоваться несколько раз в тестовом примере. Поскольку накопительные пакеты представляют собой группы команд, объединенные в одну, они вносят большой вклад в сокращение вашего тестового сценария.

Пример того, как выглядит содержимое вкладки, показан ниже.

Резюме
- Selenium IDE (интегрированная среда разработки) — самый простой инструмент в Selenium Suite.
- Он должен использоваться только в качестве инструмента для создания прототипов .
- Знание JavaScript и HTML требуется для промежуточных тем , таких как выполнение «RunScript» и «Накопительный» commands.A накопительный пакет представляет собой набор команд , которые вы можете использовать , чтобы значительно сократить ваши тестовые скрипты. Локаторы — это идентификаторы, которые сообщают Selenium IDE, как получить доступ к элементу.
- Firebug (или любое подобное дополнение) используется для получения значений локатора .
- Панель меню используется для создания, изменения и экспорта тестовых примеров в форматы, используемые Selenium RC и WebDriver.
- Формат по умолчанию для Selenese команд HTML .
- Меню «Options» обеспечивает доступ к различным конфигурациям для Selenium IDE.
- URL базы полезен при обращении относительных URL — адресов .
- Панель тестовых наборов показывает список открытых в настоящий момент тестовых случаев и краткое резюме выполненных тестов.
- Editor предоставляет интерфейс для тестовых скриптов .
- В табличном представлении ваш скрипт представлен в табличном формате с «Командой», «Целью» и «Значением» в качестве столбцов.
- Source View показывает сценарий в формате HTML .
- Вкладки « Журнал» и « Справочная информация» предоставляют обратную связь и другую полезную информацию при выполнении тестов.
- В UI-элементная и Rollup вкладка только для опытных пользователей Selenium IDE . Они оба требуют значительных усилий при кодировании JavaScript.
- UI-Element позволяет удобно отображать элементы пользовательского интерфейса с помощью JavaScript Object Notation (JSON).
В следующей таблице представлена история выпуска Selenium IDE.
| Основная версия | Дата выпуска |
|---|---|
| 1.0.10 | 06-Dec-10 |
| 1.5.0 | 15-Dec-11 |
| 1.8.1 | 01-Jun-12 |
| 2.1.0 | 30-Jun-13 |
| 2.2.0 | 06-июля-13 |
| 2.3.0 | 09-Август-13 |
| 2.5.0 | 02-Jan-14 |
| 2.8.0 | 29-Sep-14 |
| 2.9.0 | 09-Mar-15 |
| 2.9.1 | 15-Mar-15 |
| 3.0 | 11-Apr-18 |
| 3.1.0 | 26-июня-18 |
| 3.2.0 | 13-августа-18 |
| 3.4.4 | 15-Окт-18 |